
Yelp Data Reveals Nationwide Splurging on Restaurants and a Rising Interest in Fine Dining as New Restaurant Openings Increase
June 21, 2023
For more on the methodology for this report, click here.
Today, the U.S. restaurant industry and its consumer base are faced with a unique combination of economic conditions: continued staffing shortages, widespread layoffs, rising interest rates and persistent inflation driving up costs. As consumers and business owners confront these everyday challenges, Yelp data uncovers new trends in consumer demand and dining habits, especially in major metropolitans like New York, Los Angeles and San Francisco.
The restaurant industry shows strong signs of growth with business openings up nationally, especially for pop-up concepts, which entice consumers with their fleeting nature and experimental menus. Yelp data confirms rising demand among diners, with consumer interest in restaurants and nightlife businesses increasing nationally. In contrast, other discretionary spending categories have seen a sharp decrease in consumer interest, like shopping and beauty services for example. Dining habits are also shifting with consumers demonstrating an eagerness for special nights out, fine dining experiences, off-peak dining hours and last-minute reservations.
Restaurant Openings are up Nationally, Especially for Pop-up Concepts and Full-service Experiences
Amid economic uncertainty, the restaurant industry has experienced a strong comeback with new business openings up 10% nationally between April 2022 and March 2023 compared to April 2021 and March 2022. Notably, new pop-up restaurants, which began as a cost-saving solution during the pandemic, are on the rise (up 105%), growing into an industry trend that continues to see quick-service pop-ups share a space with breweries, bars and even restaurants. Many full-service restaurants also saw a spike in new business openings in the U.S., including ramen (up 45%), breakfast and brunch (up 20%), sushi (up 13%) and steakhouses (up 9%).
Business Openings for Restaurants Rose Nationally, With Pop-Ups Seeing the Highest Surge
Change in business openings by category, April 2022–March 2023 vs. April 2021–March 2022
Nationwide Consumer Interest in Restaurants, Nightlife and Entertainment Businesses is on the Rise, While Shopping and Beauty See Decline
With new openings for restaurants on the rise, Yelp data confirms increasing consumer demand for these types of businesses. Yelp assessed national and local changes in discretionary spending categories, analyzing how consumer interest has changed during the six-month period between October 2022 through March 2023, a period marked by ongoing layoffs across industries, compared to the same time period the year prior.
While discretionary categories such as beauty services and shopping (both down 6%), event planning and services (down 3%) and hotels and travel (down 2%) saw sharp decreases in nationwide consumer interest year over year, Yelp data found an increased interest in categories that provide a local experience, including arts and entertainment (up 6%), bars and nightlife (up 5%) and restaurants (up 3%).
Consumer Interest in Nightlife and Arts & Entertainment Experienced the Most Significant Increases Across States
Categories with the largest decline and growth in consumer interest by state, October 2022–March 2023 vs. October 2021–March 2022
Among arts and entertainment businesses, paint and sip businesses (up 17%) saw the most significant growth in interest. Nightlife and restaurant businesses such as speakeasies (up 18%), comedy clubs (up 17%), New Mexican restaurants (up 29%), African restaurants (up 21%) and pop-up restaurants (up 18%) experienced some of the largest increases in consumer interest year over year. Within beauty businesses, Yelp data found decreased consumer interest in permanent makeup (down 8%), eyelash services (down 7%) and makeup artists (down 5%). While shopping businesses such as computer stores (down 27%), furniture stores (down 11%), and nurseries and gardening shops (down 9%) experienced the largest declines in consumer interest.
Interest in Restaurants, Nightlife, and Entertainment Is on the Rise Nationwide
Change in consumer interest between October 2022–March 2023 vs. October 2021–March 2022
These trends remained true locally, even in some of the cities most impacted by layoffs, with California metros like San Francisco and San Jose seeing drops greater than the national trend in categories like beauty services (down 7% and 6%, respectively) and shopping (down 9% and 10%). Meanwhile, consumer interest in nightlife businesses surpassed the national average (up 5%) in San Jose (up 7%); New York (up 6%) and Seattle (up 6%). Mirroring the national trend, diners in these cities showed a slight increase in consumer interest in restaurants, up approximately 3% across San Francisco, San Jose, Seattle, Los Angeles and New York.
Increasing Consumer Interest in Restaurants Is Consistent Across Main US Cities
Discretionary categories with the largest increase and decrease of consumer interest by city between October 2022–March 2023 vs. October 2021–March 2022
Consumer Interest in Fine Dining Surpasses Pre-Pandemic Levels as Interest in Affordable Restaurants Dip
Yelp also analyzed consumer interest in restaurants across different price points, ranging from $ to $$$$ between April 2022 and March 2023 compared to the same period the year prior. The data suggests that consumers are forgoing affordable options for higher-end dining experiences. In fact, consumer interest for low price point restaurants ($) decreased by 4% nationally, while states such as Nevada (down 12%), Utah (down 11%) and Oregon (down 10%) saw the largest decreases. Food businesses (including businesses such as bakeries, coffee shops, and butchers) also saw a similar pattern with consumer interest in affordable options decreasing nearly 4%.
Contrary to some reports, Yelp data reveals that fine dining is not dead. When compared to pre-pandemic levels (April 2019 through March 2020), consumer interest decreased nearly 16% for traditionally affordable restaurants ($). Notably, interest in higher priced restaurants ($$$ and $$$$) rose nearly 10% and 17%, respectively, compared to pre-pandemic levels. We continue to see this trend year over year, with consumer interest up nearly 2% for both pricing designations ($$$ and $$$$).
Consumers Seek Pricier Restaurant Experiences as Interest in Affordable Options Dips
Percent change in consumer interest based on price point, compared to pre-pandemic levels
Diners Shift to Earlier Meals and Avoid Planning Ahead
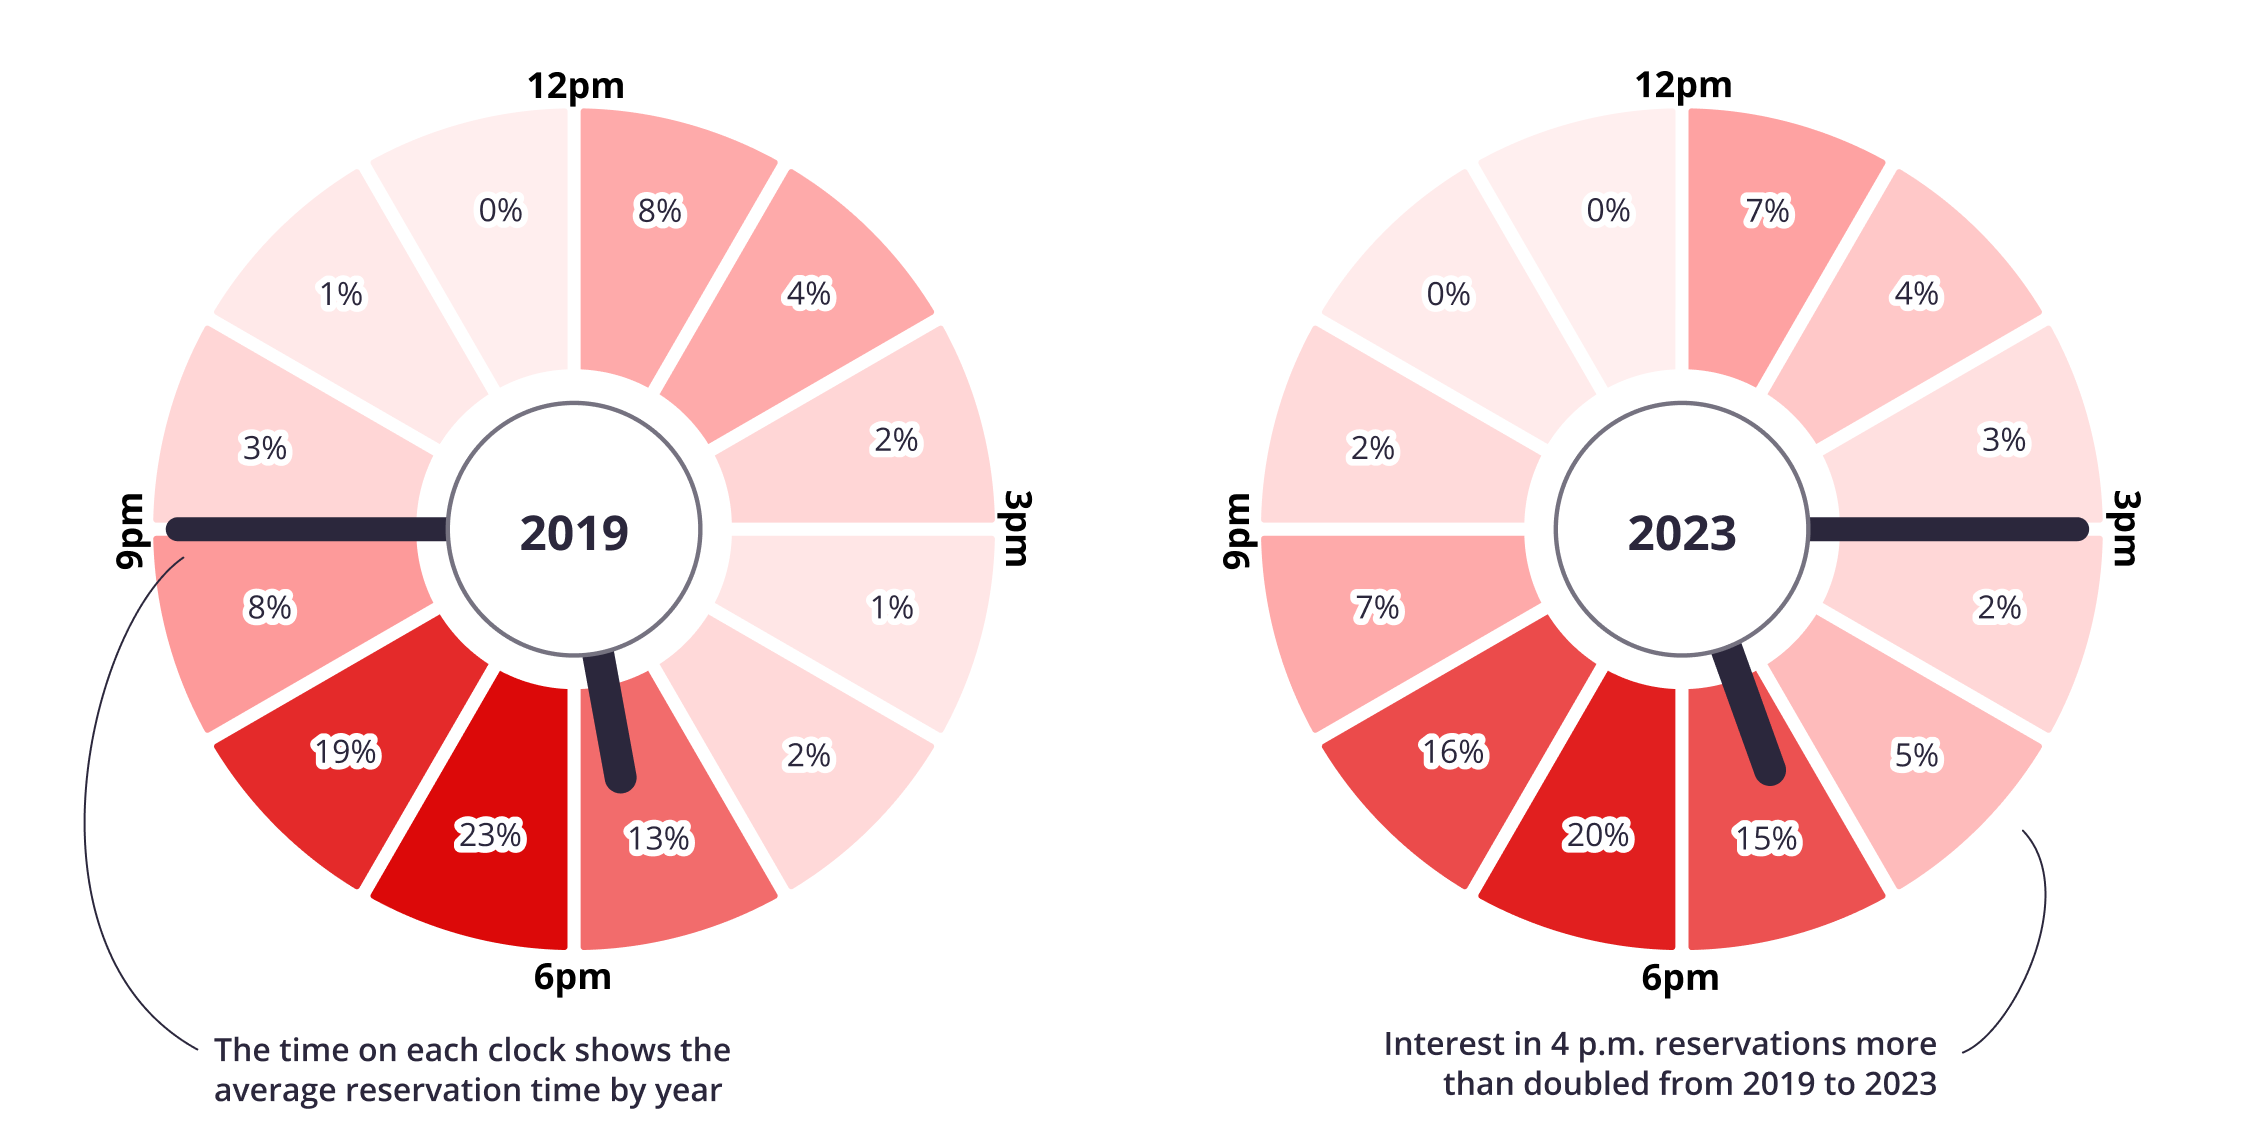
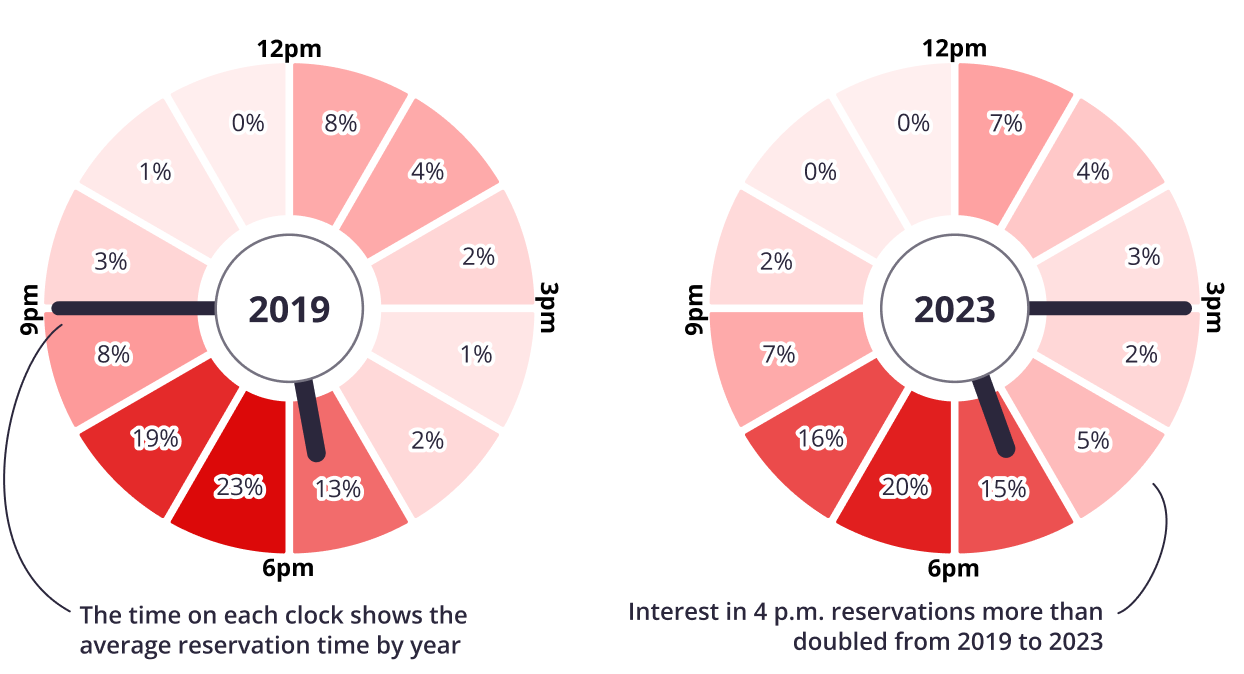
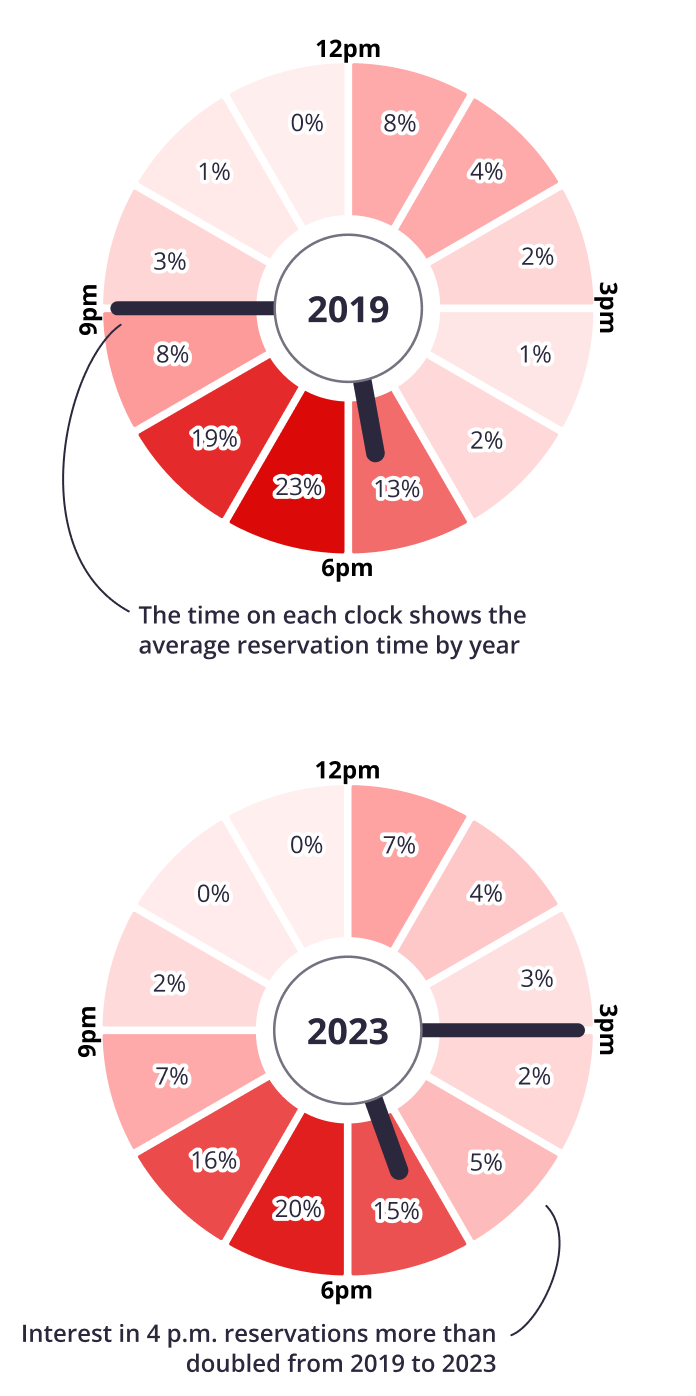
As consumer interest in restaurants increases nationally, some dining habits are changing with diners signaling an interest in earlier reservation times. In 2023, 10% of all diners were seated between 2-5 p.m., which doubled from 5% compared to the same time period in 2019 (pre-pandemic). Notably, interest in less busy times for restaurants jumped, with 4 p.m. reservations more than doubling from 2% in 2019 to 5% in 2023. However, evenings (5 p.m.-12 a.m.) still remain the most popular time for dining reservations on weekends, accounting for nearly 60% of daily reservations and 6 p.m. remaining the prime reservation time, accounting for 20% of daily reservations.
Diners Are Making Earlier Dinner Reservations
Share of reservations made on Yelp by time of day, 2019–2023
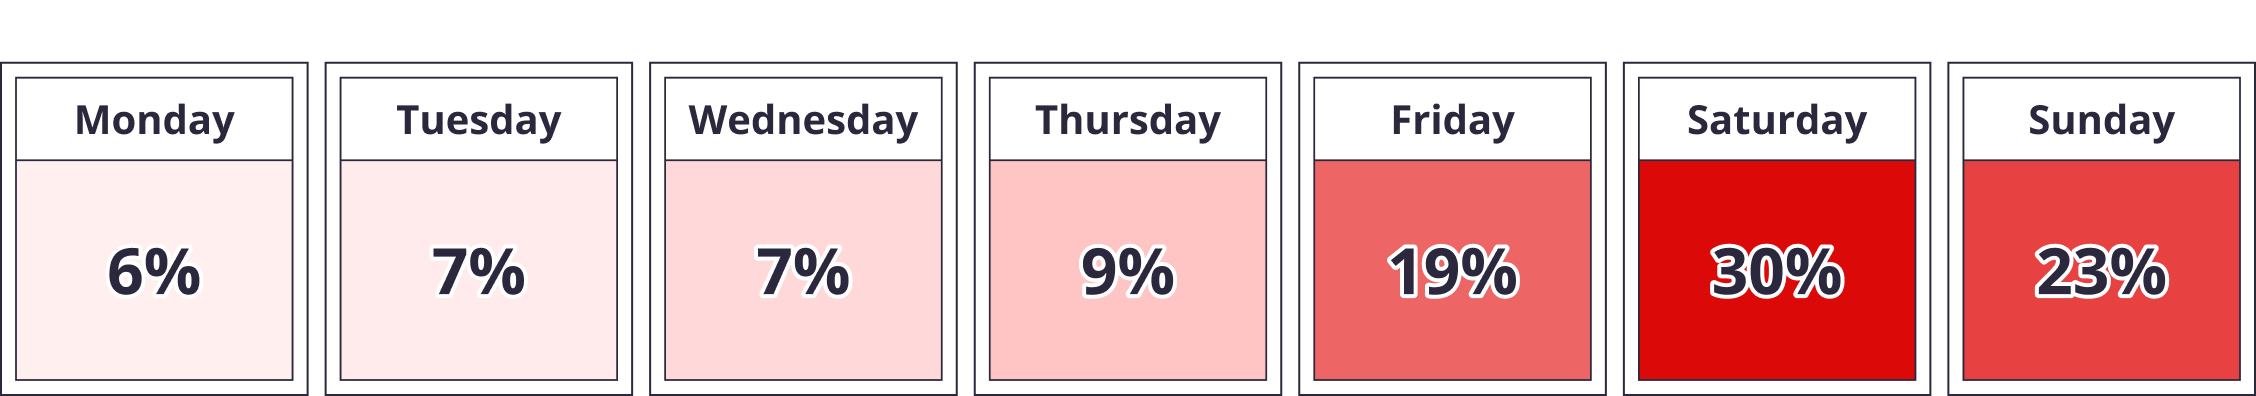
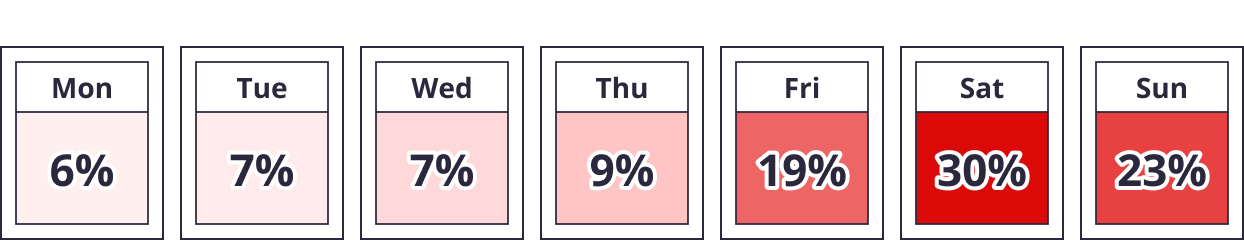
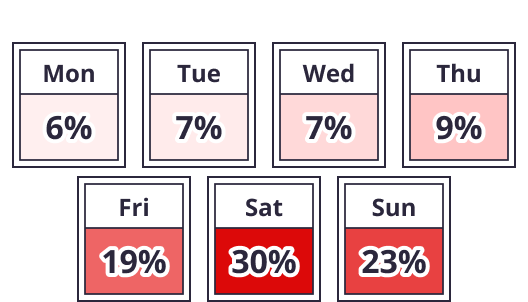
Diners’ preferred days have remained consistent with weekends, more specifically Saturdays, continuing to lead as the most popular day of the week for eating out, accounting for 30% of weekly reservations, followed by Sunday and Friday (23% and 19% of weekly reservations, respectively).
Saturday Remains the Most Popular Day for Dining Reservations
Total share of reservations made on Yelp by day of the week, 2019–2023
In our Q2 2022 Yelp Economic Average Report, Yelp found that consumers were booking reservations further in advance than ever before. Yelp data now shows a new shift of many diners booking last-minute reservations, with a majority of reservations (59%) being made on the same day or the day before the reservation.
These findings remain consistent even across major dining-out holidays such as Valentine’s Day and Mother’s Day. In 2022, more than one in four (27%) diners using Yelp Reservations waited until the last minute, booking the same weekend.
As consumer dining habits continue to evolve, the restaurant and nightlife industries change with them, creating new ways to earn consumers’ interest with memorable experiences, pop-ups and fine dining menus. Amid current economic uncertainties, Yelp will continue to track how consumers invest their time and dollars, and how business owners adapt over time.
If you'd like additional detail on how the economy is shifting, please contact us at press@yelp.com or join our mailing list to receive an email when new reports are released.
Interested in learning how Yelp data can assist you in developing market insights for your business? Yelp Knowledge can help, learn more here.
Methodology
Discretionary Spending Categories
Yelp identified the arts & entertainment, nightlife, restaurants, food, hotels & travel, event planning & services, beauty & spas, and shopping categories as those that primarily include businesses whose products and/or services are discretionary.
Consumer Interest
Yelp measures consumer interest by looking at select actions users take in connection with businesses on Yelp: such as viewing business pages, or posting photos or reviews.
Changes in consumer interest for each category were measured by comparing year-over-year data across various timelines to uncover trends, focusing on each category’s share of all consumer actions in its root category or child category.
Business Openings
Business openings refer to the new businesses listings on Yelp in a given timeframe. The business listings are added by either business representatives or Yelp users. To understand how business openings for a given location changed over time, openings are adjusted year-over-year, meaning openings are measured relative to the same time period in the previous period for the same business categories and geographic locations. This adjustment aims to account for seasonality.
Price Filter
There are 4 pricing tiers ($, $$, $$$, and $$$$) on Yelp and the pricing tier of a business is voted on by Yelp users. Consumer interest for each price filter is measured based on businesses that have been identified as belonging to a pricing tier.
Diners Seated Via Yelp
Diners Seated via Yelp includes diners seated via the Yelp app, Yelp on web or widgets on restaurant websites, it excludes diners seated via walk-in diners, phone calls and other host adds.
Downloadable static graphics can be found here.
See Yelp's previous Coronavirus Economic Impact Reports at our Data Science Medium, Locally Optimal.