
Yelp Data Reveals How the Labor Shortage and Inflation are Impacting the Restaurant Industry as People Flock Back to On-Premise Dining
June 2022
For more on the methodology for this report, click here.
The restaurant industry is going through a period of unprecedented change, accelerated by the pandemic and this year punctuated by record inflation. From shifts in operating models, to worker shortages and supply chain issues, the industry has faced challenging business conditions on its road to recovery. While 2020 was a turbulent year, 2021 proved to be a transitional year for restaurants, and Yelp data reveals that 2022 promises to turn the tables for the industry.
Yelp data shows that while consumers and restaurants are continuing to feel the impact of the industry’s labor shortage, many restaurants are also experiencing an increase in reservations, as well as high requests for both indoor and outdoor dining. Yet, even as on-premise dining picks up, takeout demand remains high. Yelp data also reveals that experience-focused dining is seeing a pop in new business openings as people look to find more unique dining options when they do go out.
Labor shortage and inflation challenges continue to impact the restaurant industry
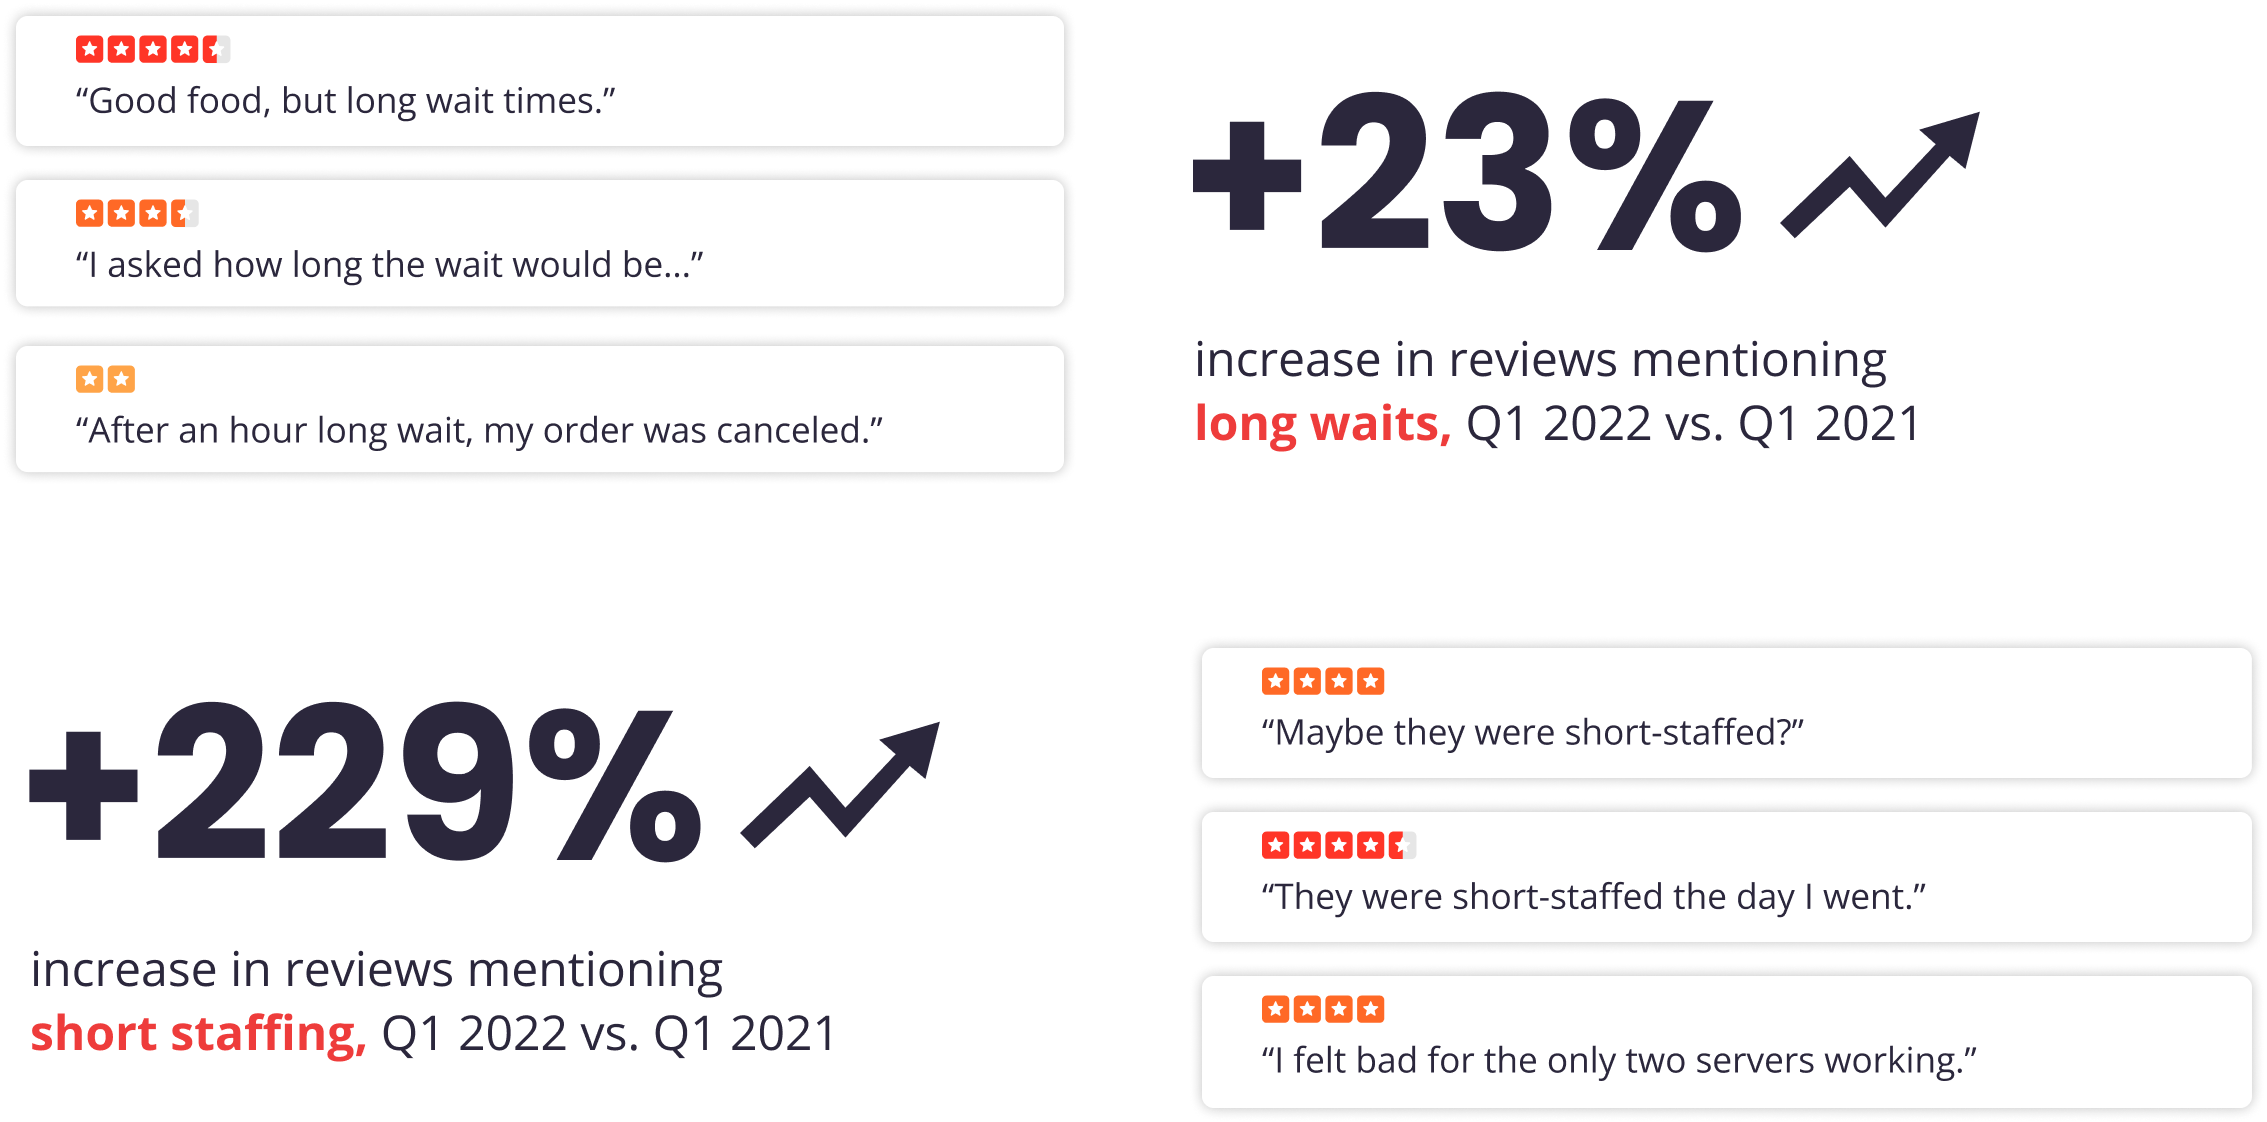
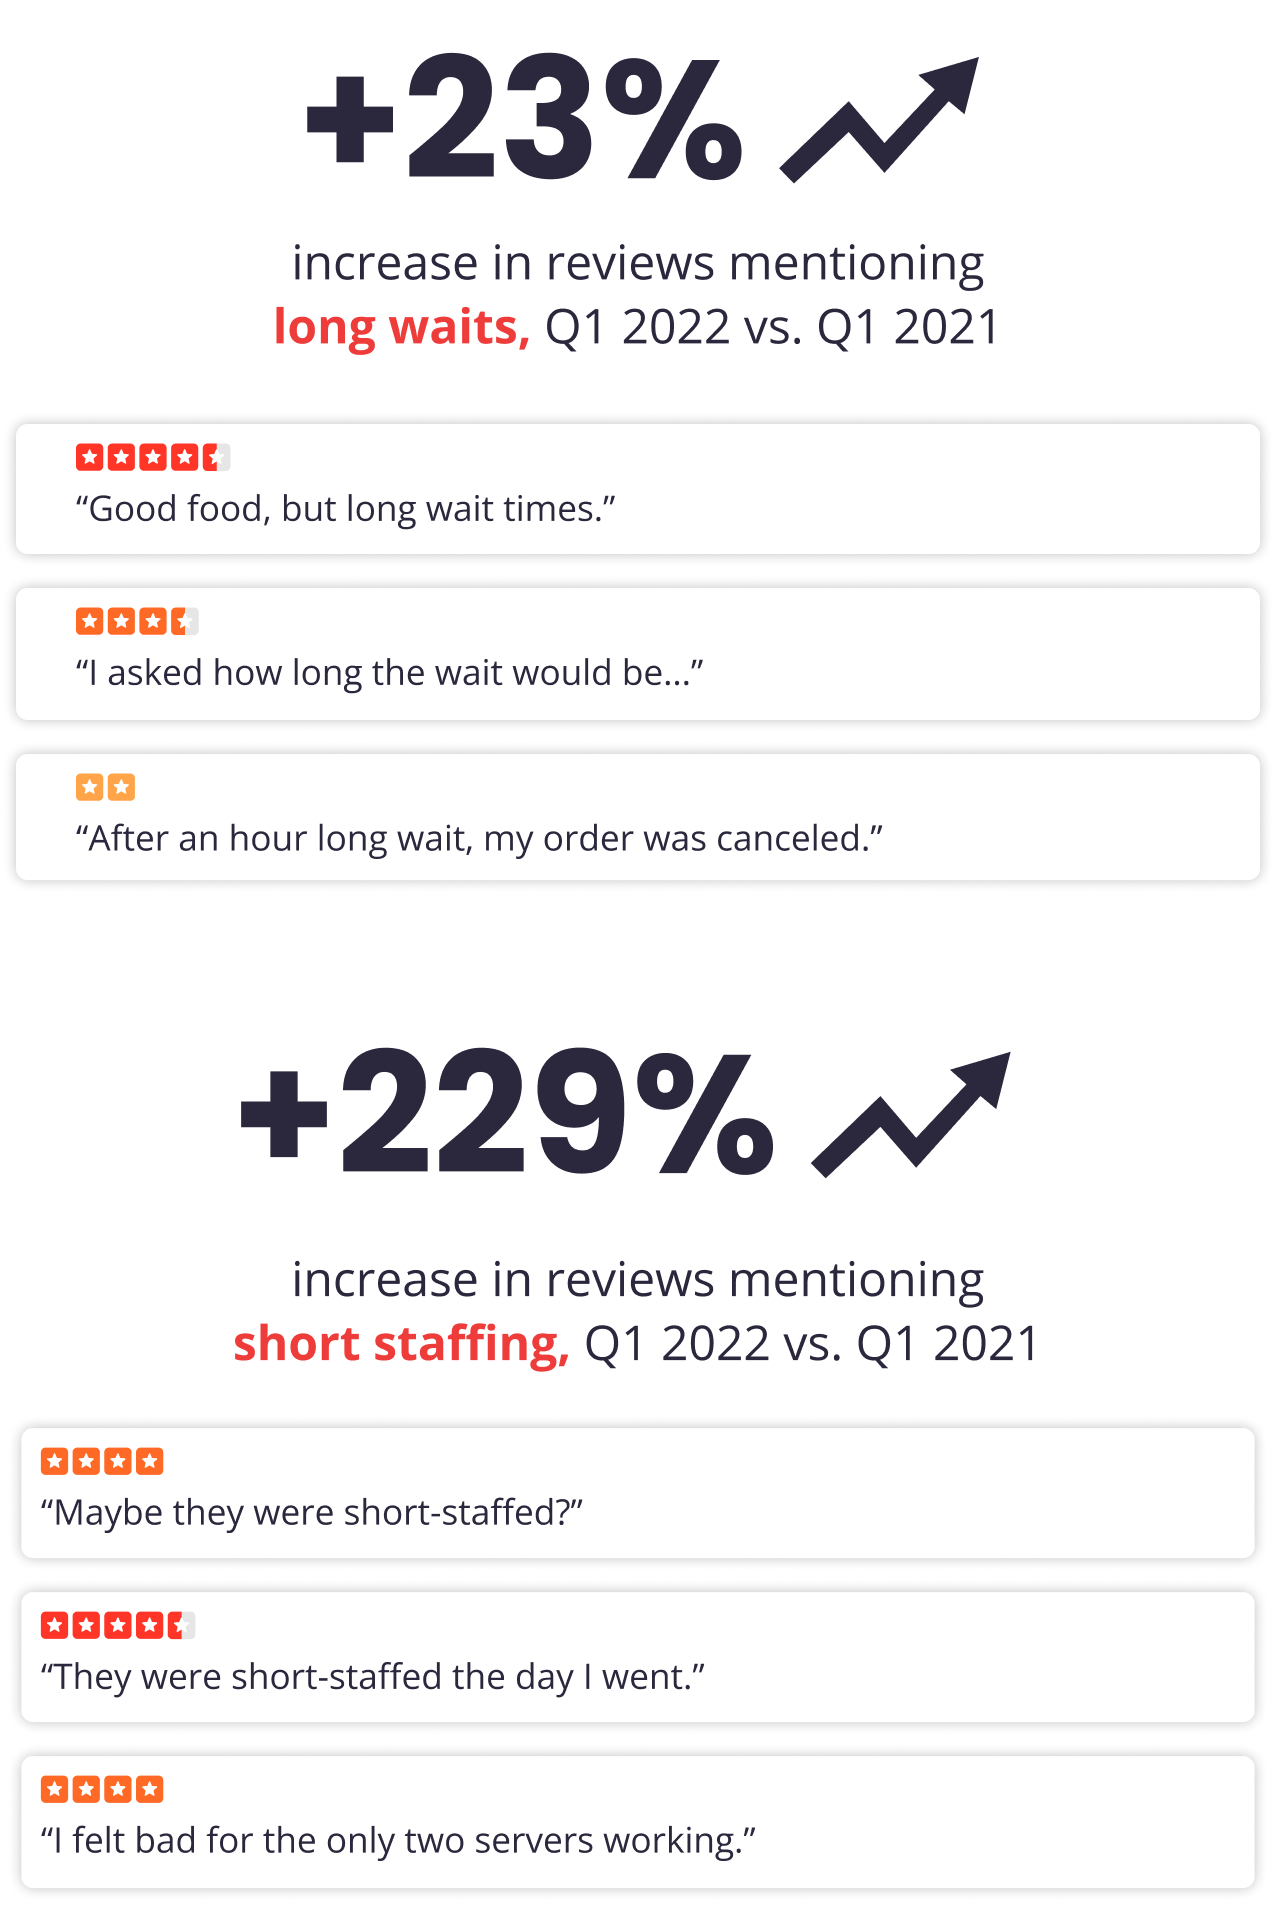
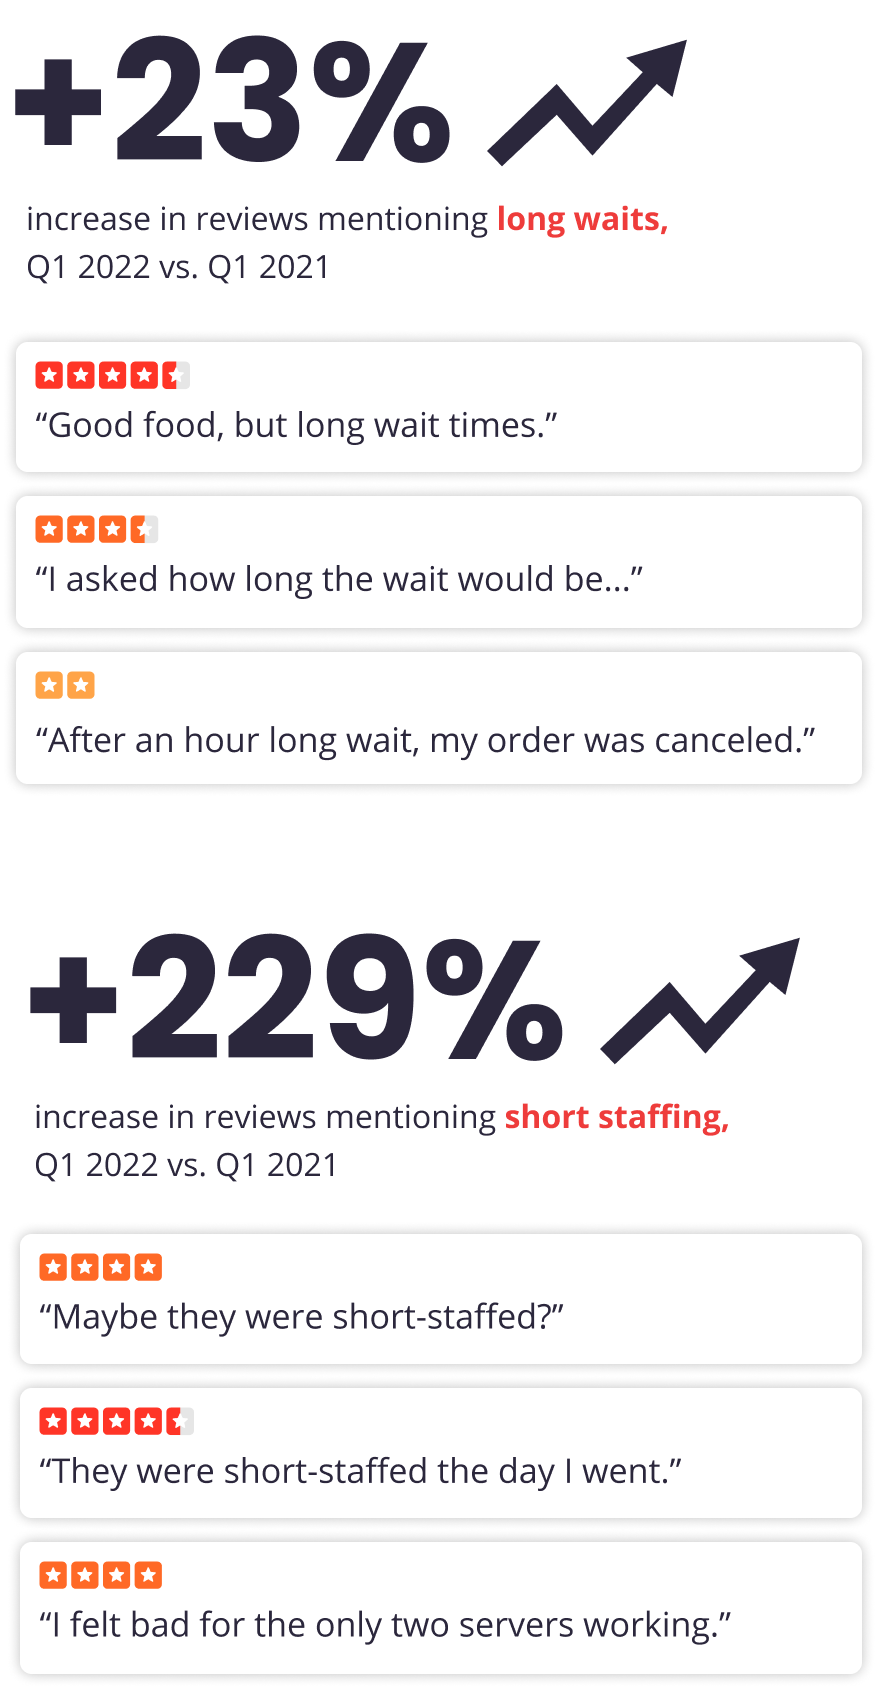
Across the restaurant industry, the ongoing labor shortage continues to be a top challenge facing restaurants. Yelp data shows that in Q1 2022, consumers mentioned long waits (23%) and short staffing (229%) more in reviews than in Q1 of the previous year.
To address this industry wide challenge, many restaurants have continued to adjust their operating hours, menu options, available tables and more. As Americans are increasingly returning to on-premise dining at restaurants with more than 13 million diners seated via Yelp* in Q1 2022, up 48% compared to Q1 2021, some have embraced technologies, like Yelp Guest Manager, to more easily handle front-of-house operations — automating check-in, managing waitlists and contacting diners — to allow hosts to support other areas of the business. By automating specific steps in the dining experience, the savings on labor can be re-distributed in other ways to the restaurant.
Consumers Increasingly Notice Long Waits and Short Staffing
In addition to longer wait times, consumers are also experiencing near-record menu price inflation, and Yelp data reveals that consumers are conscious of these price changes. Review mentions of increased prices were up 25% in Q1 2022. Yet, as we previously reported in Q1 2022, many consumers are actually seeking out higher-priced dining experiences, which could mean that while conscious of inflation they want to spend their money on high quality experiences.
The return to on-premise dining has especially grown in cities in the Southeast and California. Southeast cities with the highest year-over-year quarterly growth include: Panama City, FL (diners seated via Yelp up 212% in Q1 2022 compared to Q1 2021), Huntsville, AL (up 183%), Sevierville, TN (up 183%), Columbia, SC (up 176%), LaGrange, GA (up 158%), Port St. Lucie, FL (up 113%), Fort Myers, FL (up 97%) and Memphis, TN (up 73%). California cities with the most growth include: Vallejo (up 917%), Santa Cruz (up 225%), Stockton (up 187%), Santa Barbara (up 170%), Thousand Oaks (up 166%), Salinas (up 158%), San Francisco (up 158%) and San Jose (up 145%).
Diners Seated via Yelp are Increasing Across the U.S., Especially in the Southeast and California
40% Change
100% Change
Increase
Decrease
On-premise dining is back, while takeout remains strong
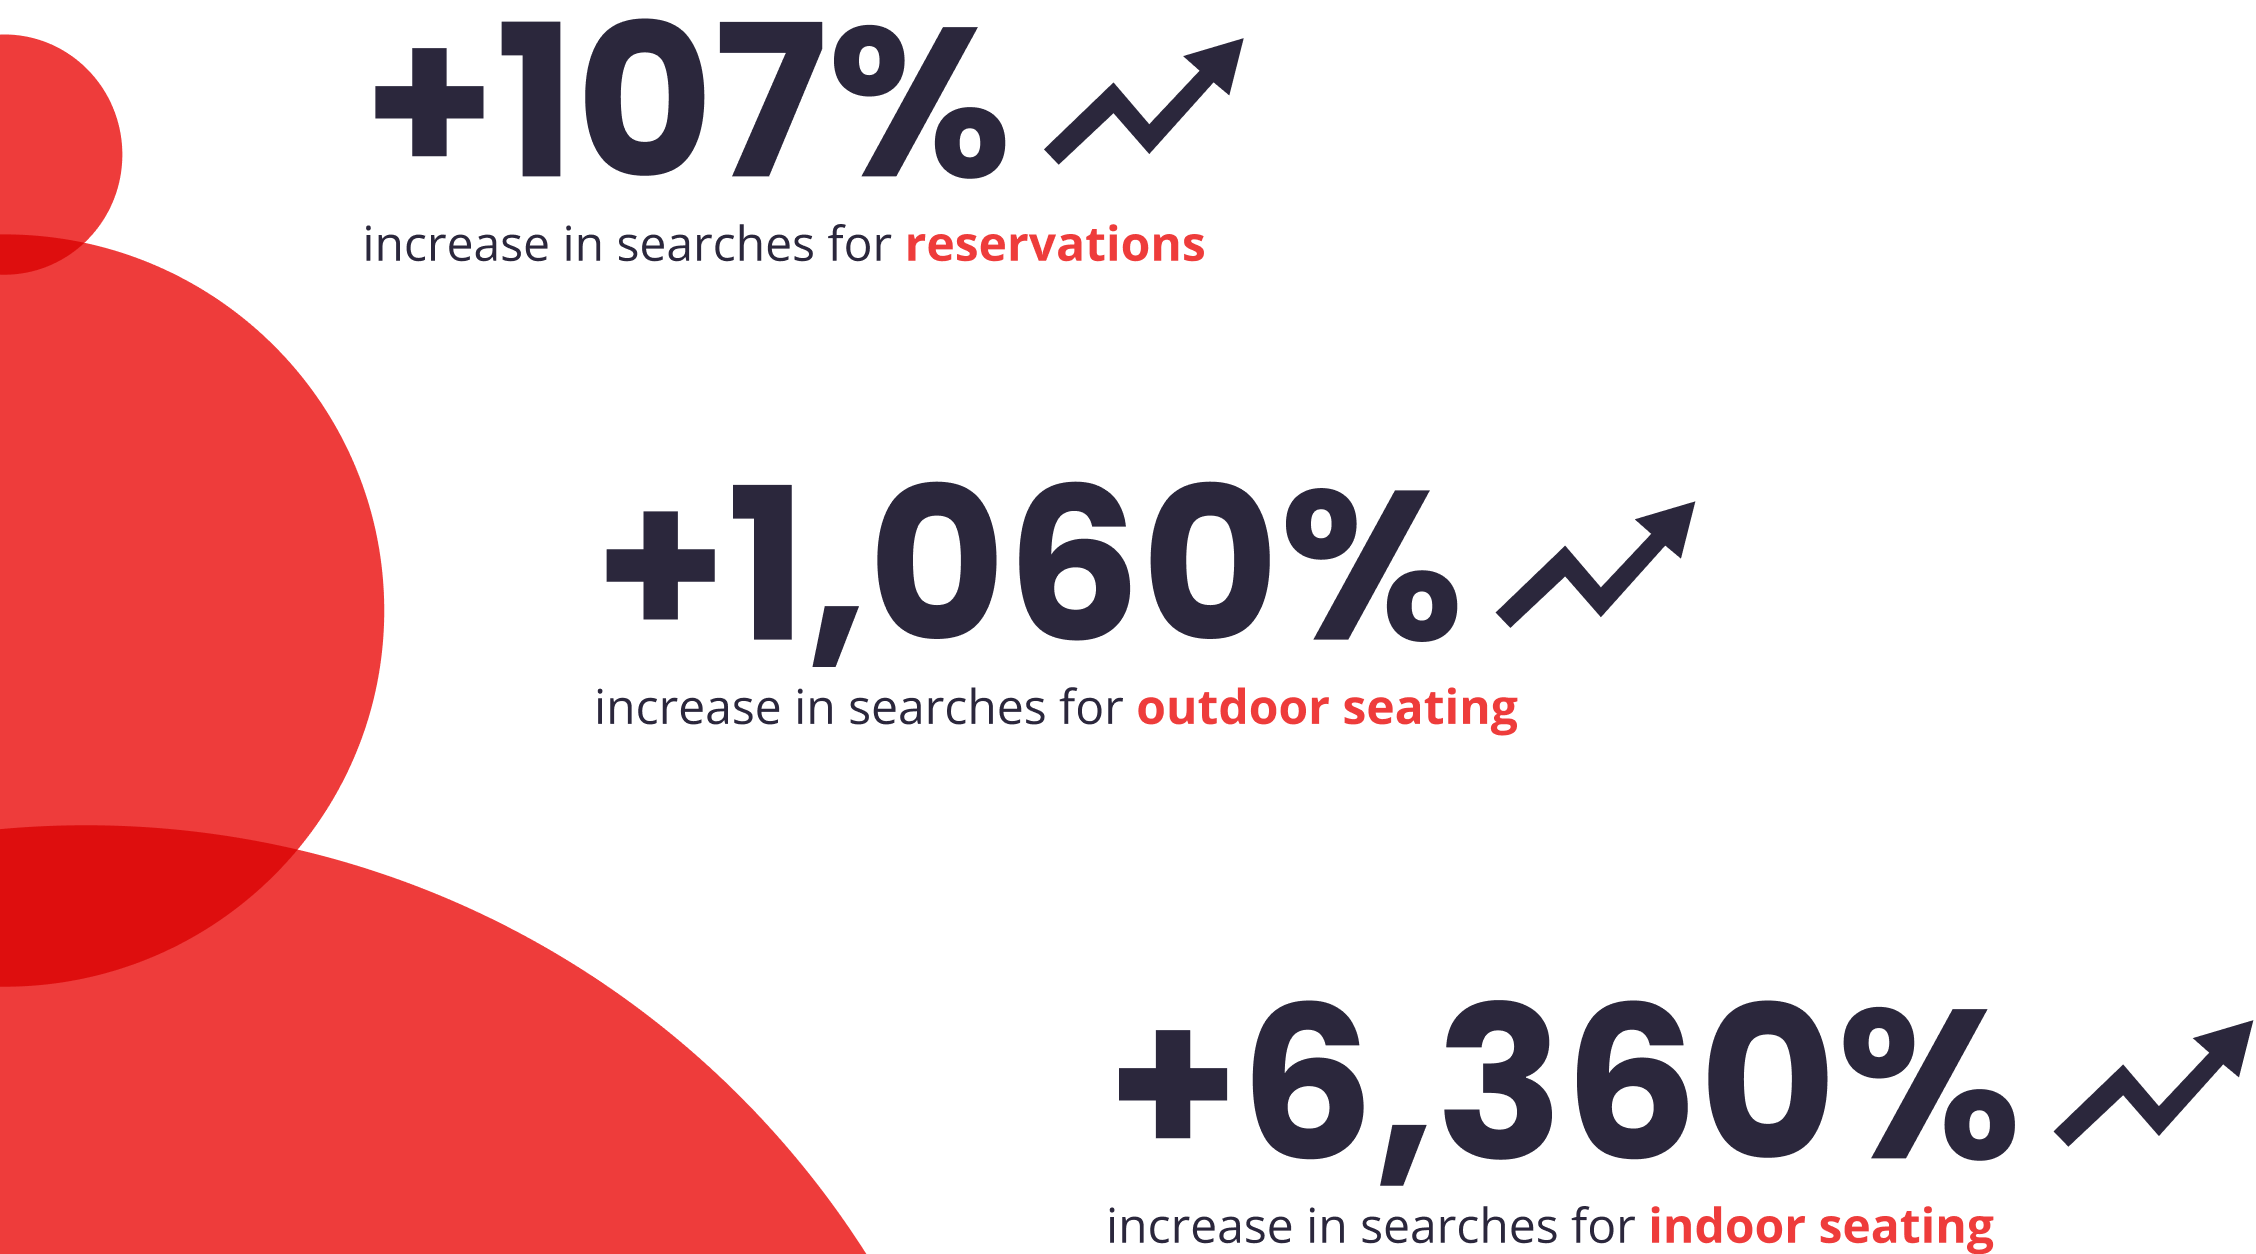
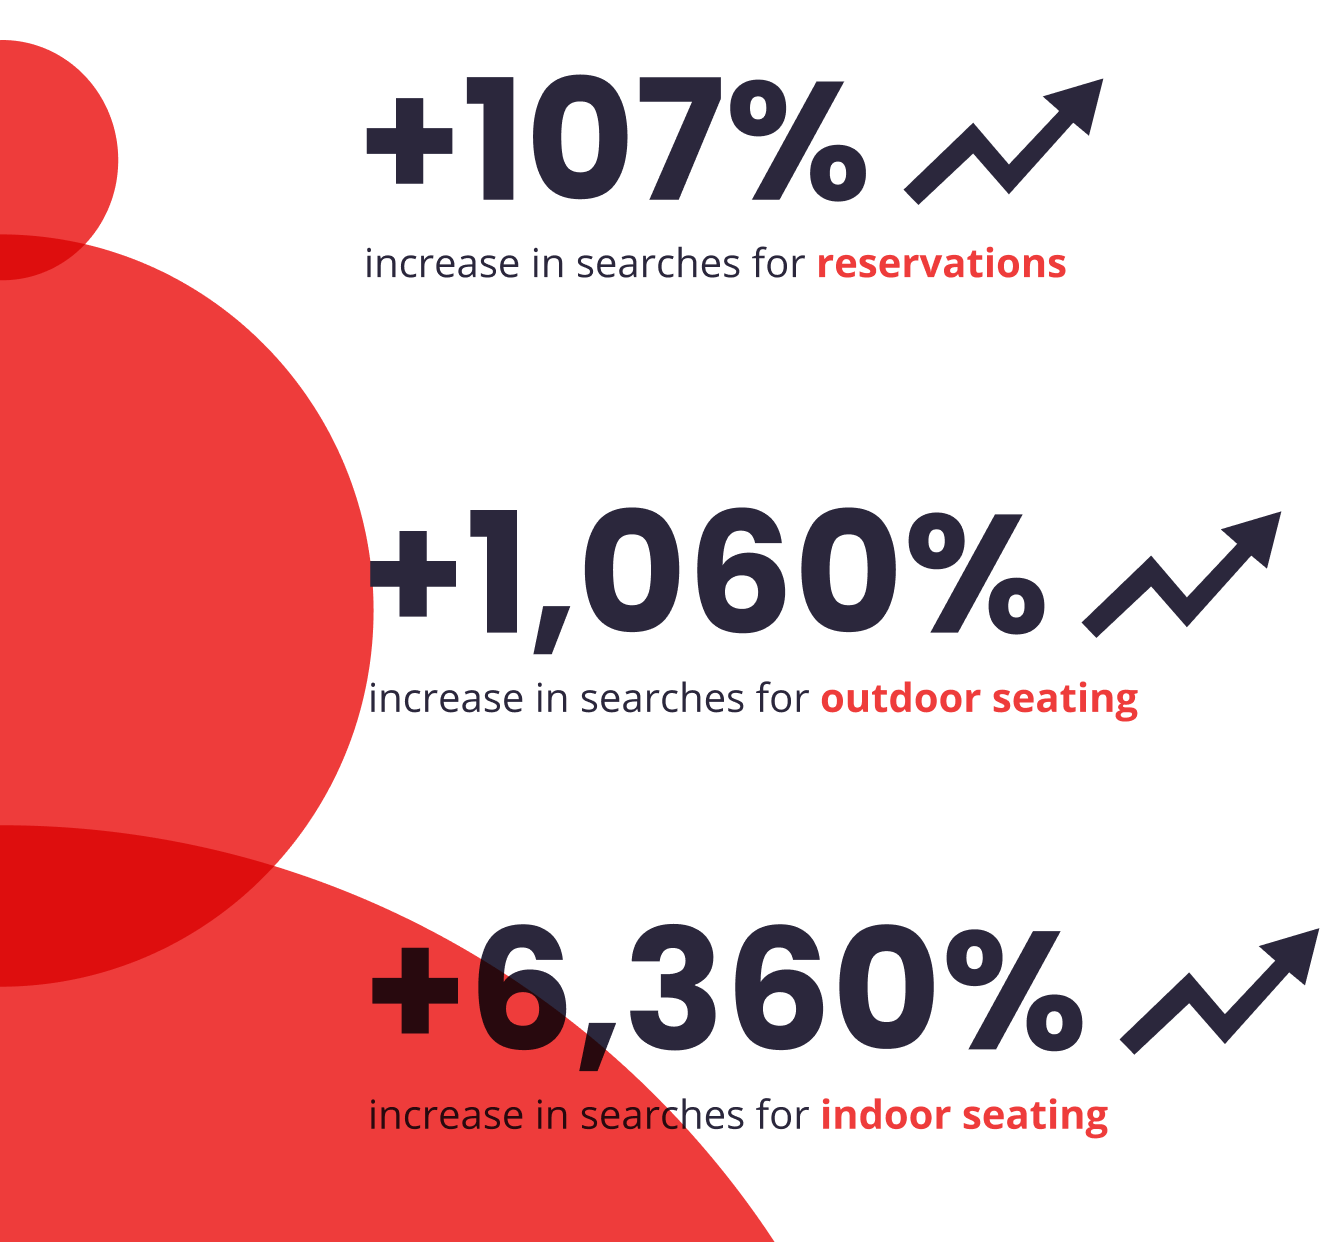
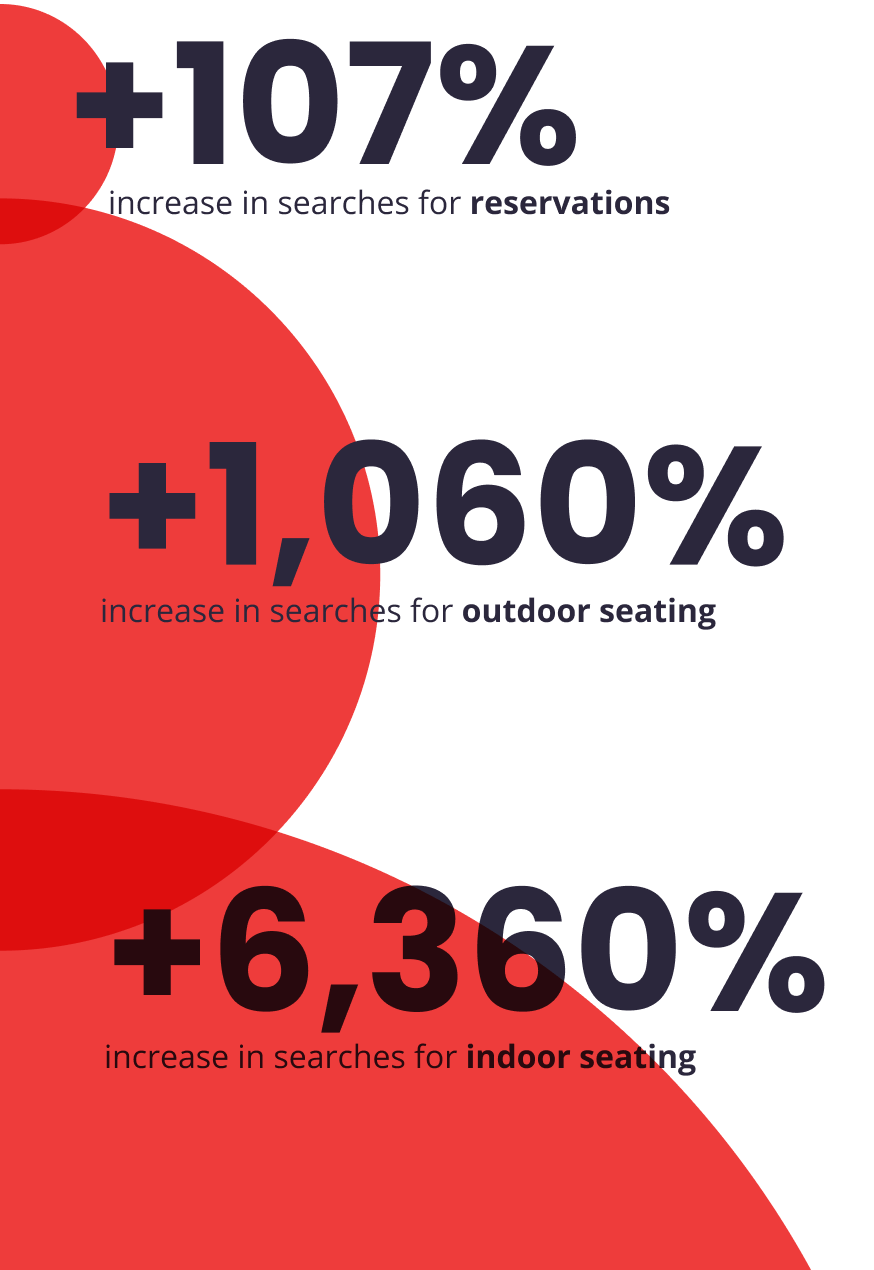
Food delivery and takeout saw exponential growth during the pandemic’s early stages as consumers stayed at home, but as COVID-19 cases decreased, the return to on-premise dining has started to accelerate. Searches for reservations in Q1 2022 were up 107% compared to Q1 2021. As dining restrictions have eased and more people are vaccinated, Yelp data indicates that consumers are expressing a preference for indoor seating, while demand for outdoor seating still remains high. Searches for outdoor seating were up 1,060% in Q1 2022, compared to the same period in Q1 2020. Meanwhile, searches for indoor dining were up 6,360% compared to the same period in Q1 2020. These large increases also further demonstrate the rarity of these kinds of searches before the pandemic.
On-premise Dining is Back in Full Force
Change in searches on Yelp, Q1 2022 vs. Q1 2020
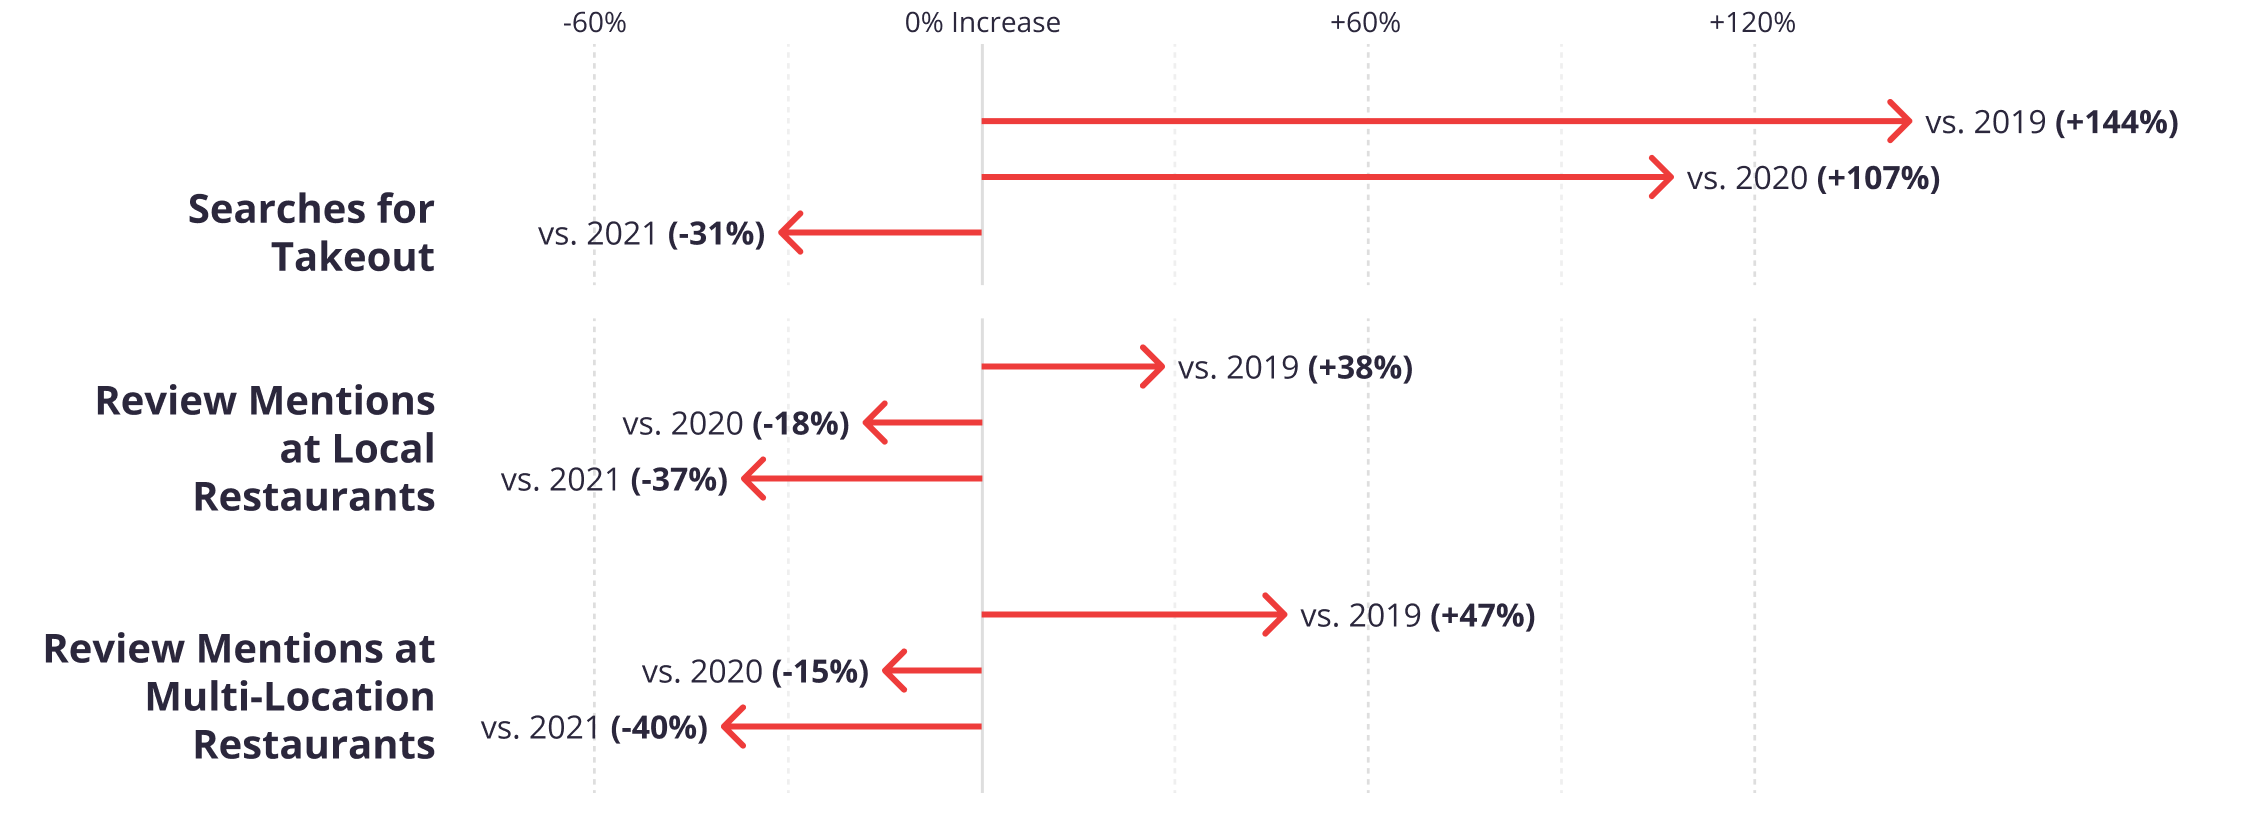
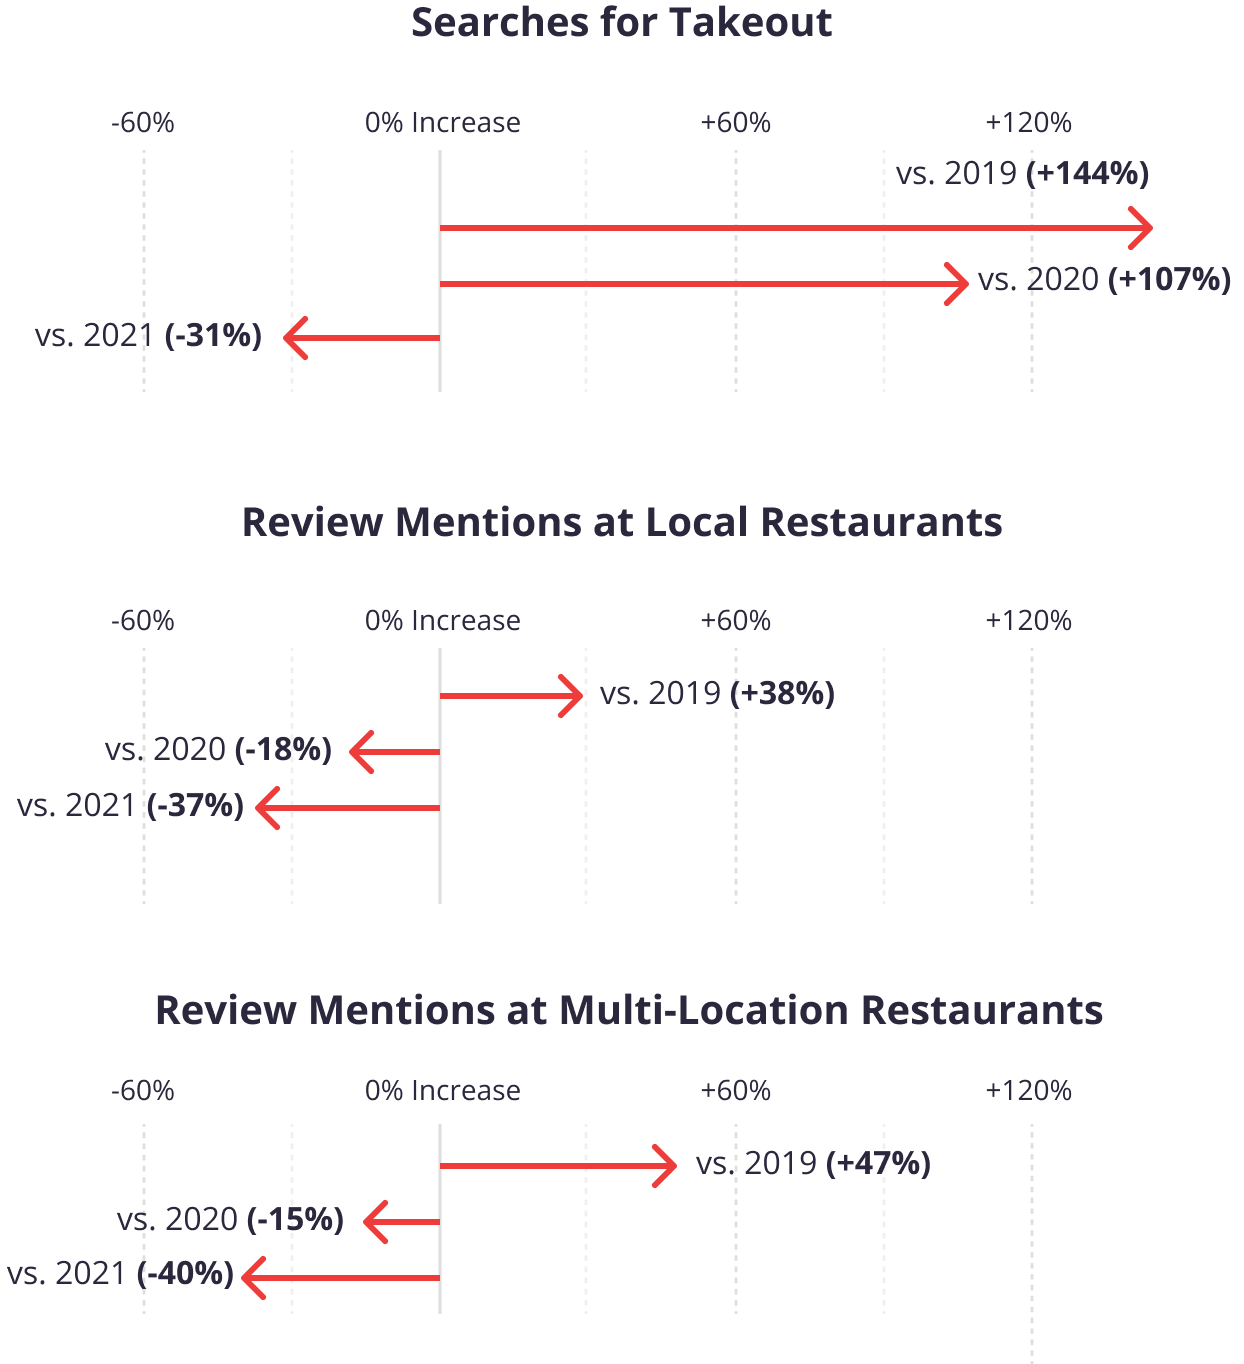
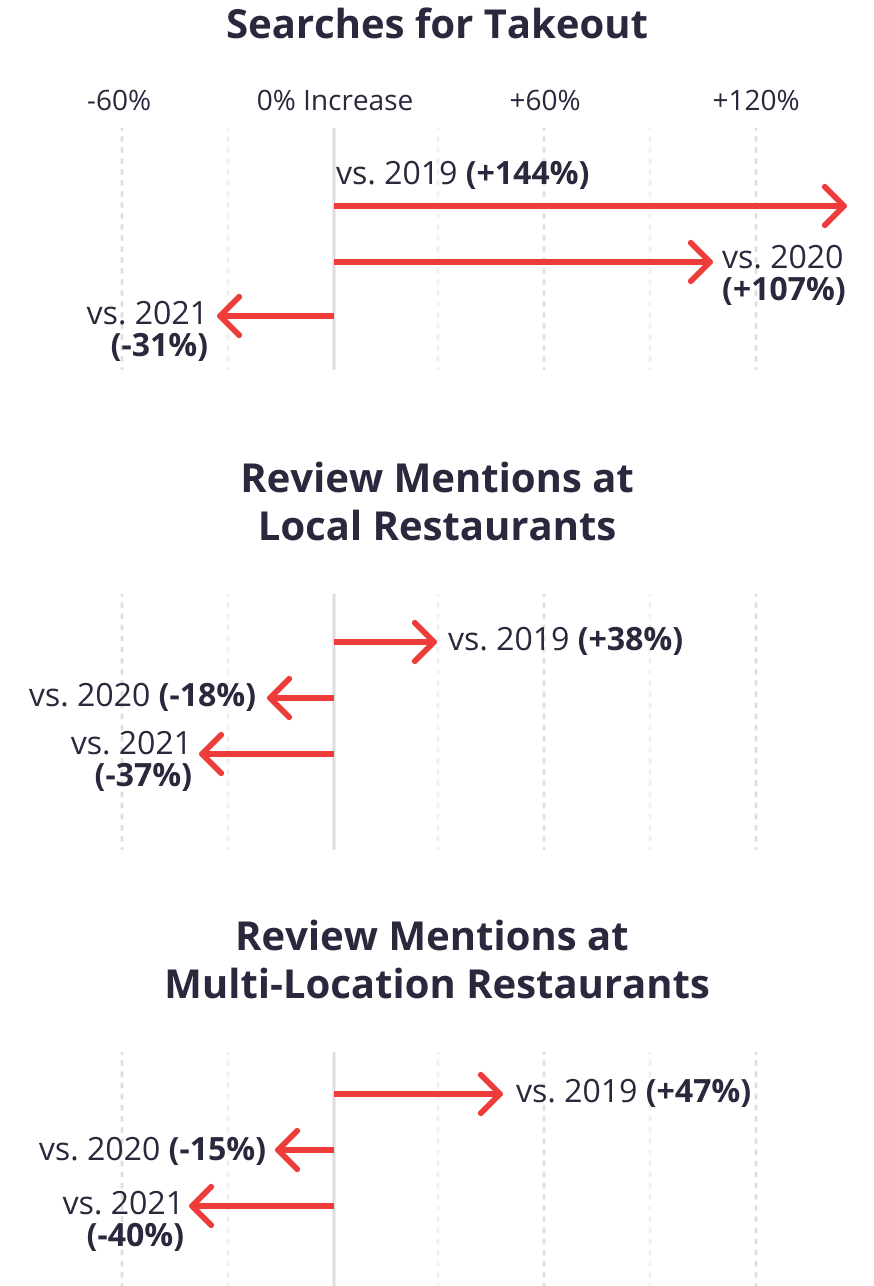
As on-premise dining rebounds, takeout remains strong. Consumers searched for takeout 31% less than in Q1 2021, but 107% more than in Q1 2020 and 144% more than in Q1 2019 – demonstrating that takeout has become a pandemic trend that may be here to stay. This remains true across both local (defined as restaurants with five or less locations) and multi-location restaurants (defined as restaurants with more than five locations). Review mentions of takeout at local restaurants in 2022 are 37% lower compared to the same period (Jan-April) in 2021, and 38% higher than in the same period of 2019. Review mentions of takeout at multi-location restaurants in 2022 are 40% lower compared to the same period (Jan-April) in 2021, and 47% higher than in the same period of 2019. Notably, compared to the pre-pandemic period, review mentions of takeout for multi-location restaurants grew by 9 percentage points more than for single-location restaurants (+47% vs +38%).
Takeout Interest Remains High, Especially at National and Chain Restaurants
Change in review mentions and searches for takeout Q1 2022 vs. previous years
Experience focused dining explodes as consumers head back to restaurants
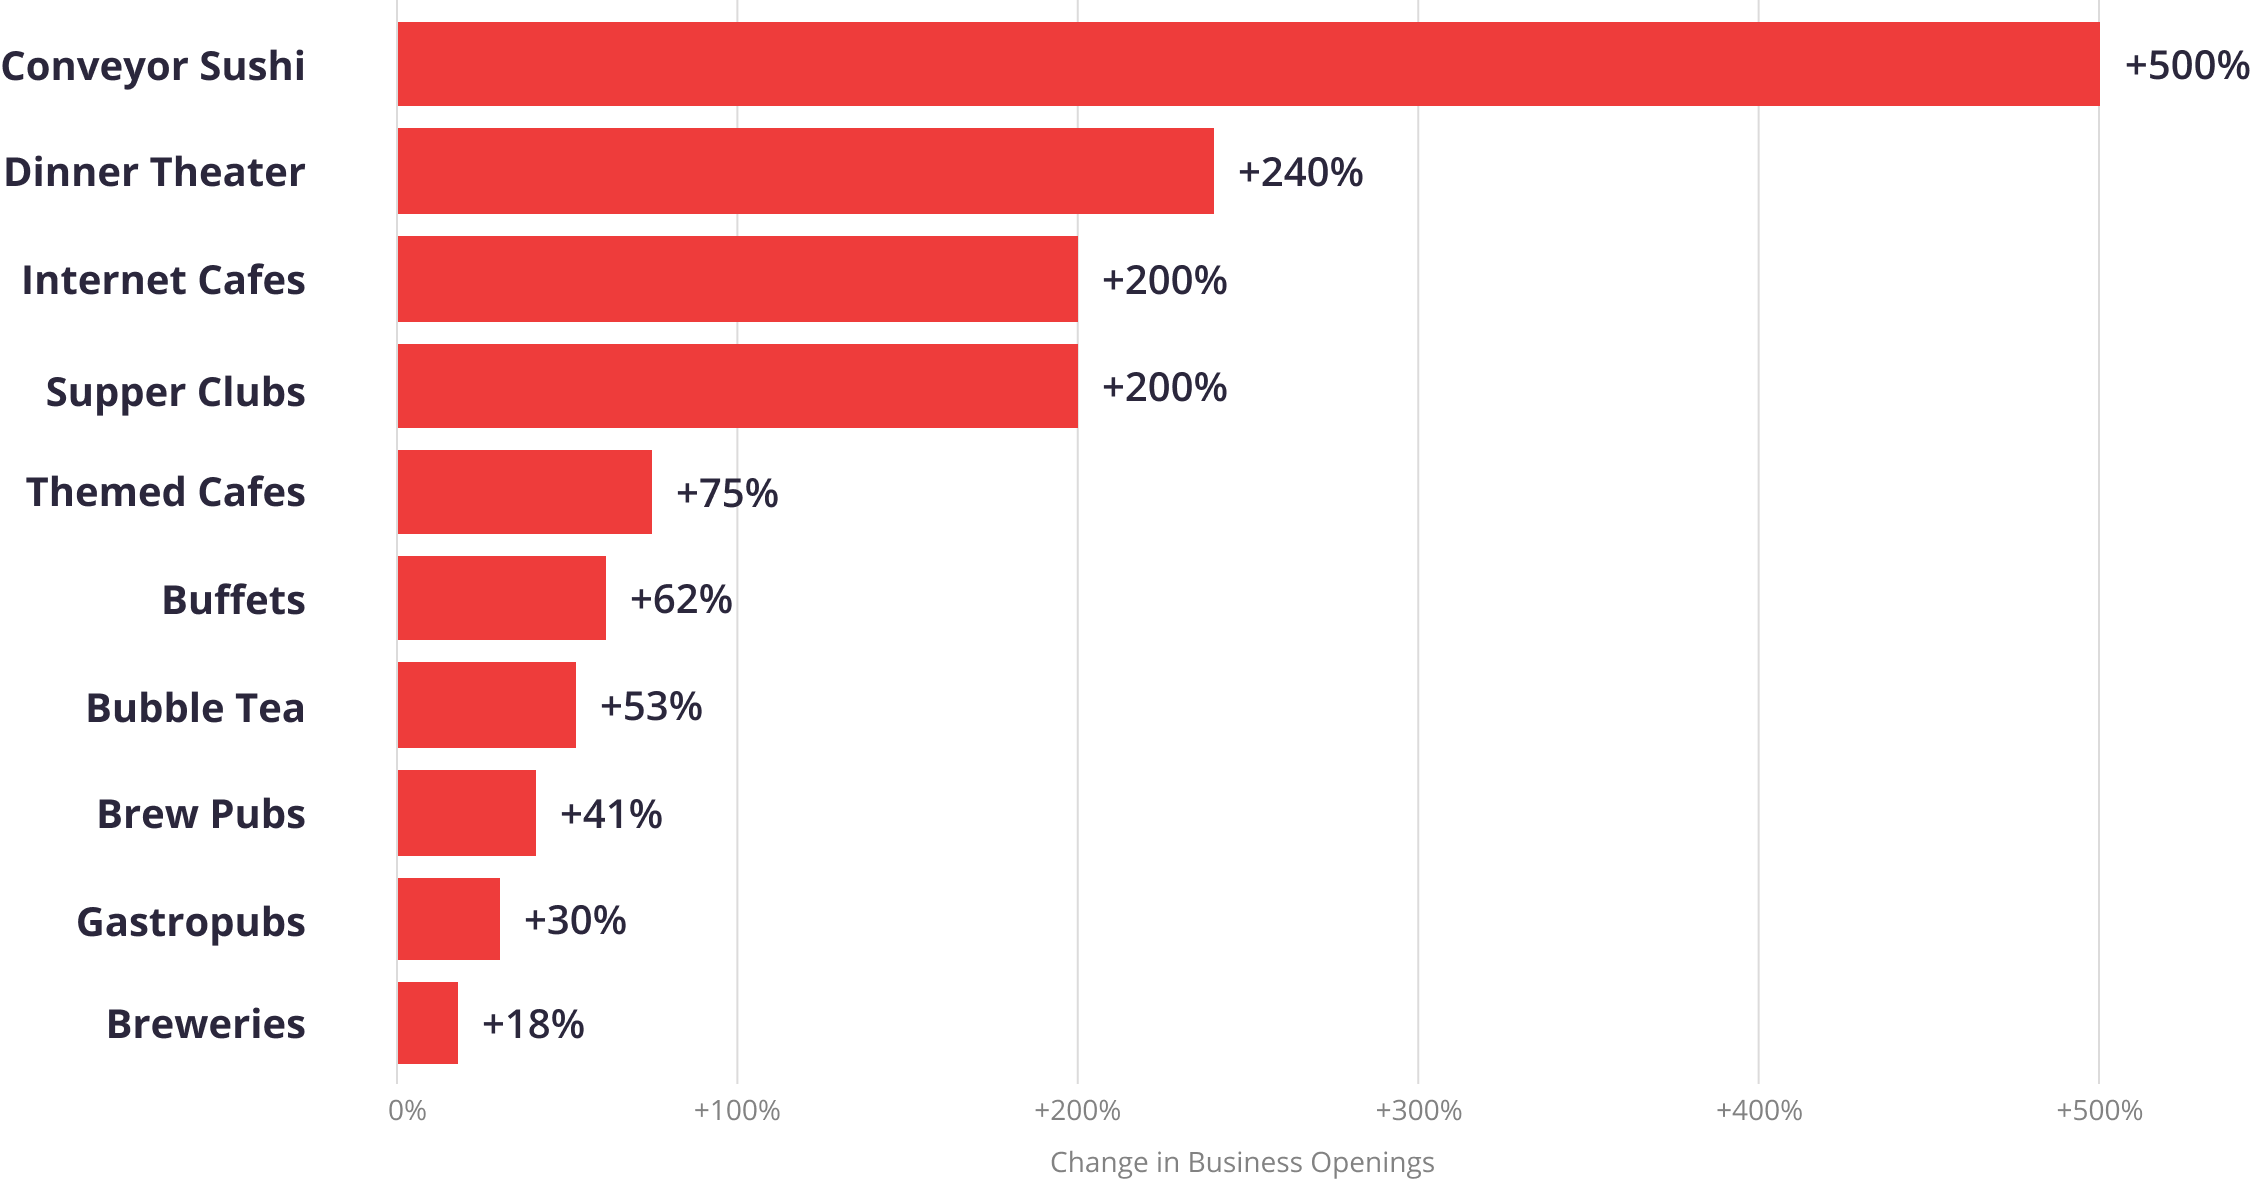
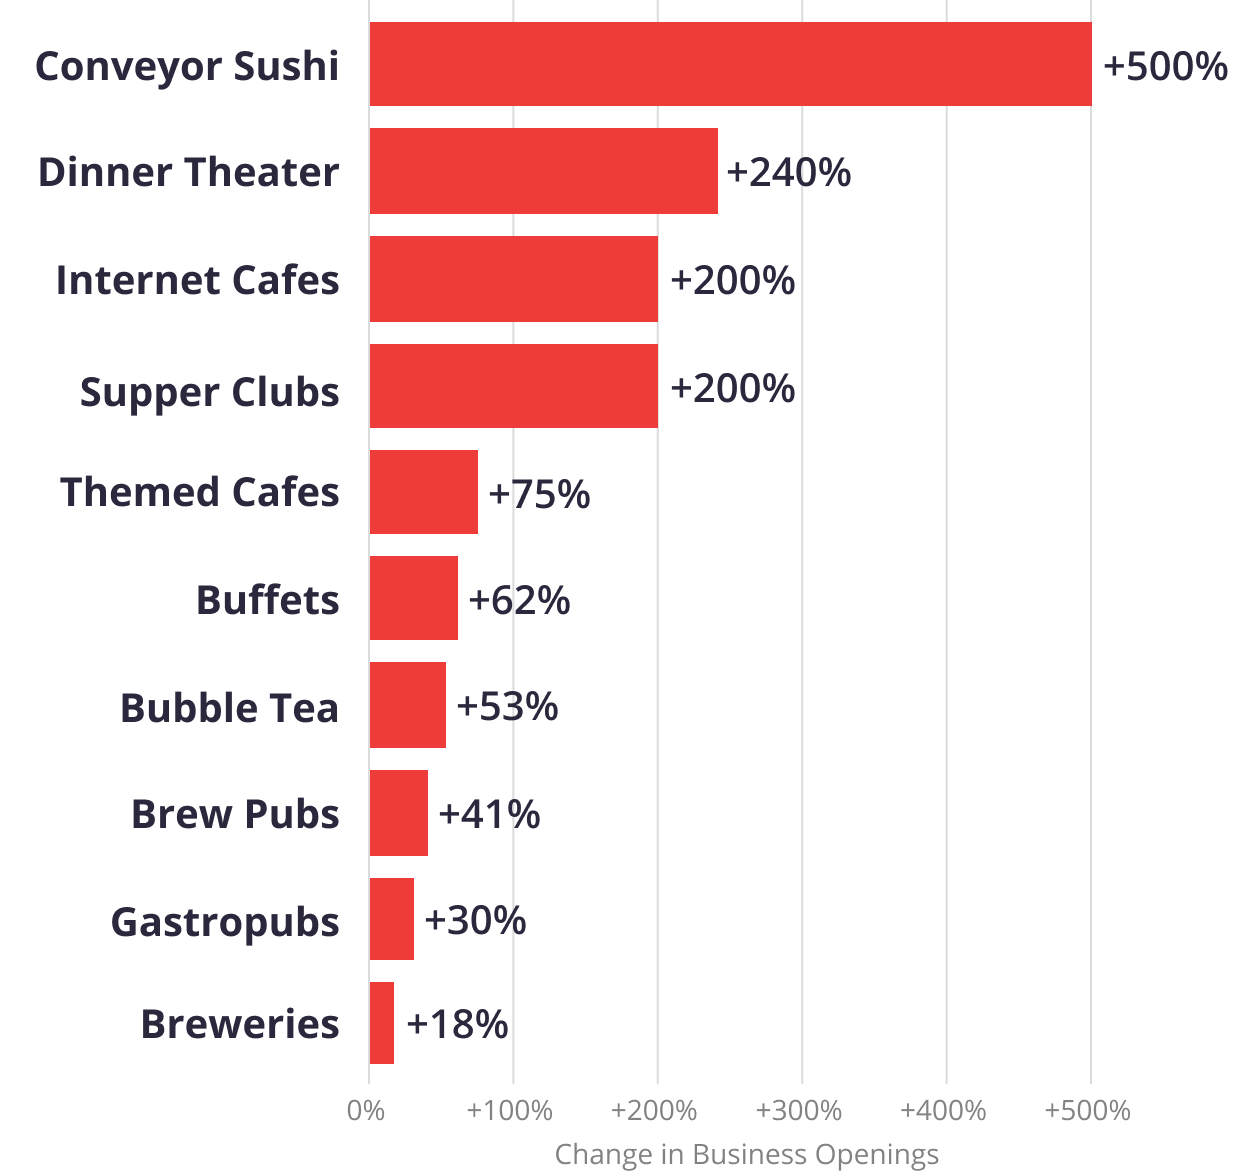
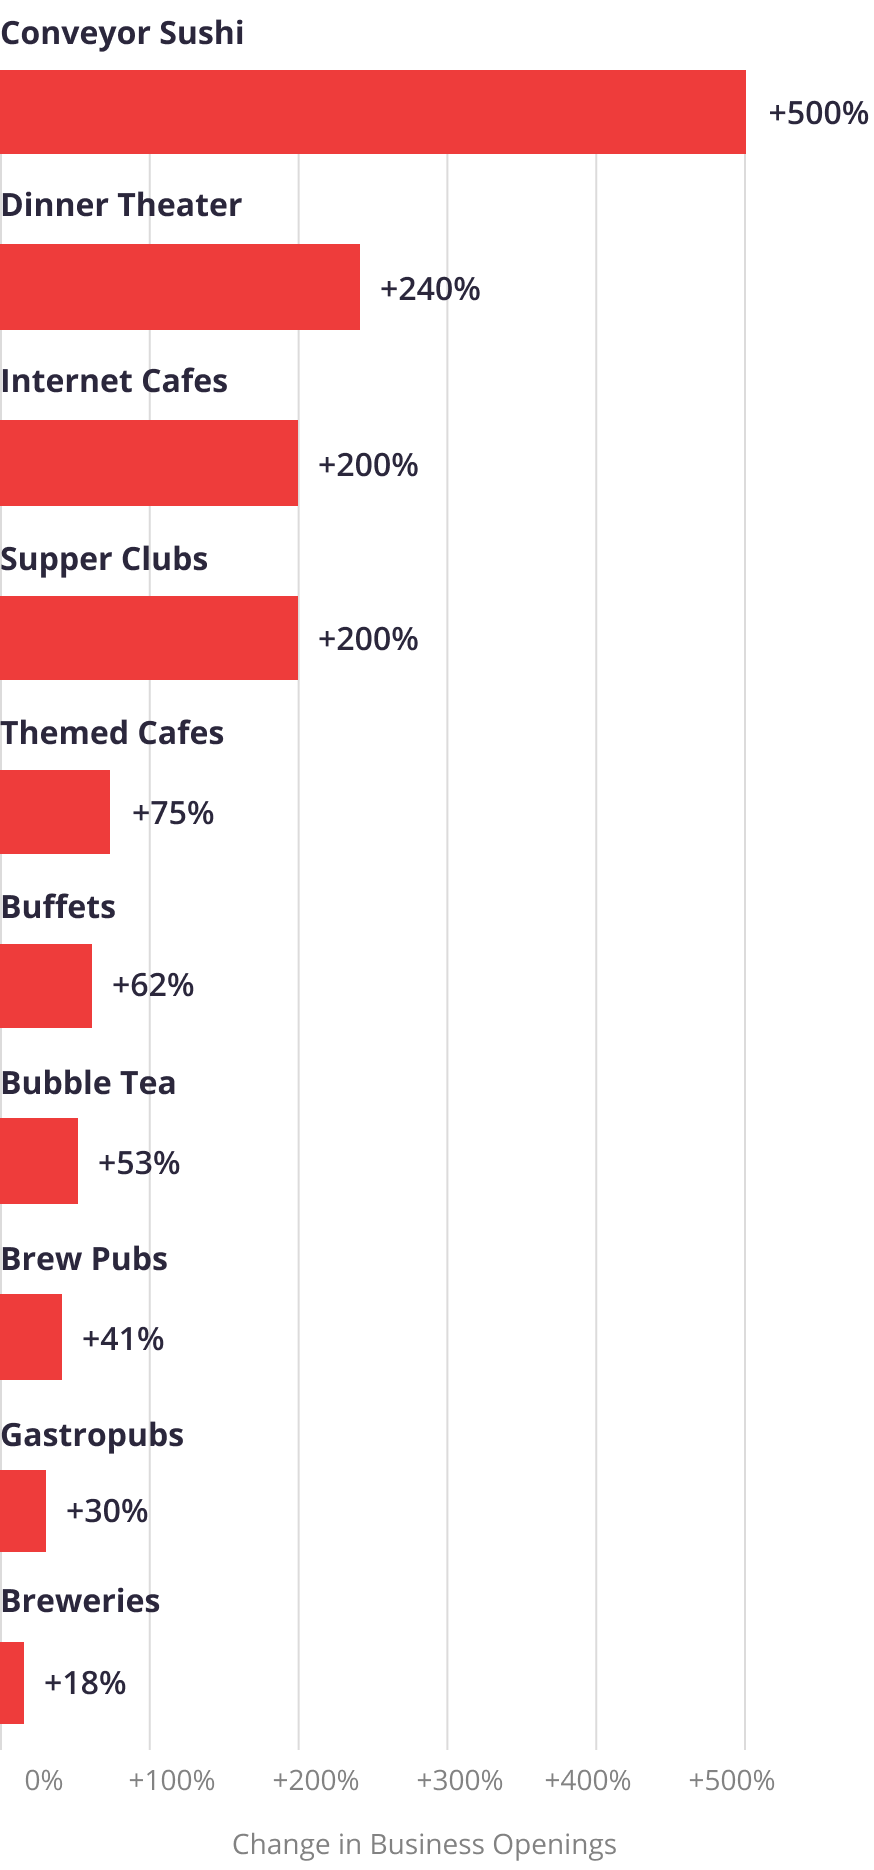
As the restaurant industry continues on its road to recovery, there is optimism for its future. New restaurants open every day, and on Yelp, we’ve seen growth in more unique dining experiences like conveyor sushi (up 500%, compared to Jan-April 2021) supper clubs (up 200%), and themed cafes (75%).
Businesses Openings Are Exploding For Select Restaurant Categories
Change in business openings on Yelp, Jan – Apr 2022 vs. Jan – Apr 2021
On Yelp, ghost kitchens, which emerged during the pandemic as a way for restaurants to drive additional revenue, continue to surge as well. More than 3,000 businesses have added the attribute to their business pages since its September 2021 launch.
As people continue to re-enter “normal” life, many diners are returning to dining and restaurants are eager to welcome them back.
If you'd like additional detail on how the economy is shifting, please contact us at press@yelp.com or join our mailing list to receive an email when new reports are released.
Interested in learning how Yelp data can assist you in developing market insights for your business? Yelp Knowledge can help, learn more here.
Methodology
Consumer Interest
We measure consumer interest by looking at select actions users take to connect with businesses on Yelp: such as viewing business pages, or posting photos or reviews.
Changes in consumer interest for each category were measured by comparing year-over-year data from the first quarter of the years 2015-2022, focusing on each category’s share of all consumer actions in its root category.
Search and review text analysis
We examined phrases containing or matching takeout, reservations, indoor dining, and outdoor seating and their respective appearances in searches on the Yelp platform. To understand how the search volume of these terms changed over time, we compared the frequency of the phrases against their frequencies from prior periods.
Similarly, we examined phrases containing or matching terms such as long waits, increased prices, and short staffing and their appearances in reviews on Yelp. To understand how the review volume of these terms changed over time, we compared the frequency of the phrases against their frequencies from prior periods.
Metrics related to popularity of certain searches or review mentions are normalized per every million searches/reviews (i.e. a 23% increase in reviews mentioning long waits means that the number of reviews mentioning long waits per every million total reviews has increased by 23%).
New Business Openings
Openings are determined by counting new businesses listed on Yelp, which are added by either business representatives or Yelp users. Openings are adjusted year-over-year, meaning openings are measured relative to the same time period in the previous period for the same business categories and geographic locations. This adjustment corrects for both seasonality and any differences in the baseline level of Yelp coverage in any given category and geography.
Diners Seated Via Yelp
Diners Seated via Yelp includes diners seated via the Yelp app or Yelp on web, it excludes diners seated via Waitlist widgets on restaurant websites, walk-in diners, phone calls and other host adds.
Downloadable static graphics can be found here.
See Yelp's previous Coronavirus Economic Impact Reports at our Data Science Medium, Locally Optimal.