
Carl Bialik
Data Editor
July 2019
Q2 2019
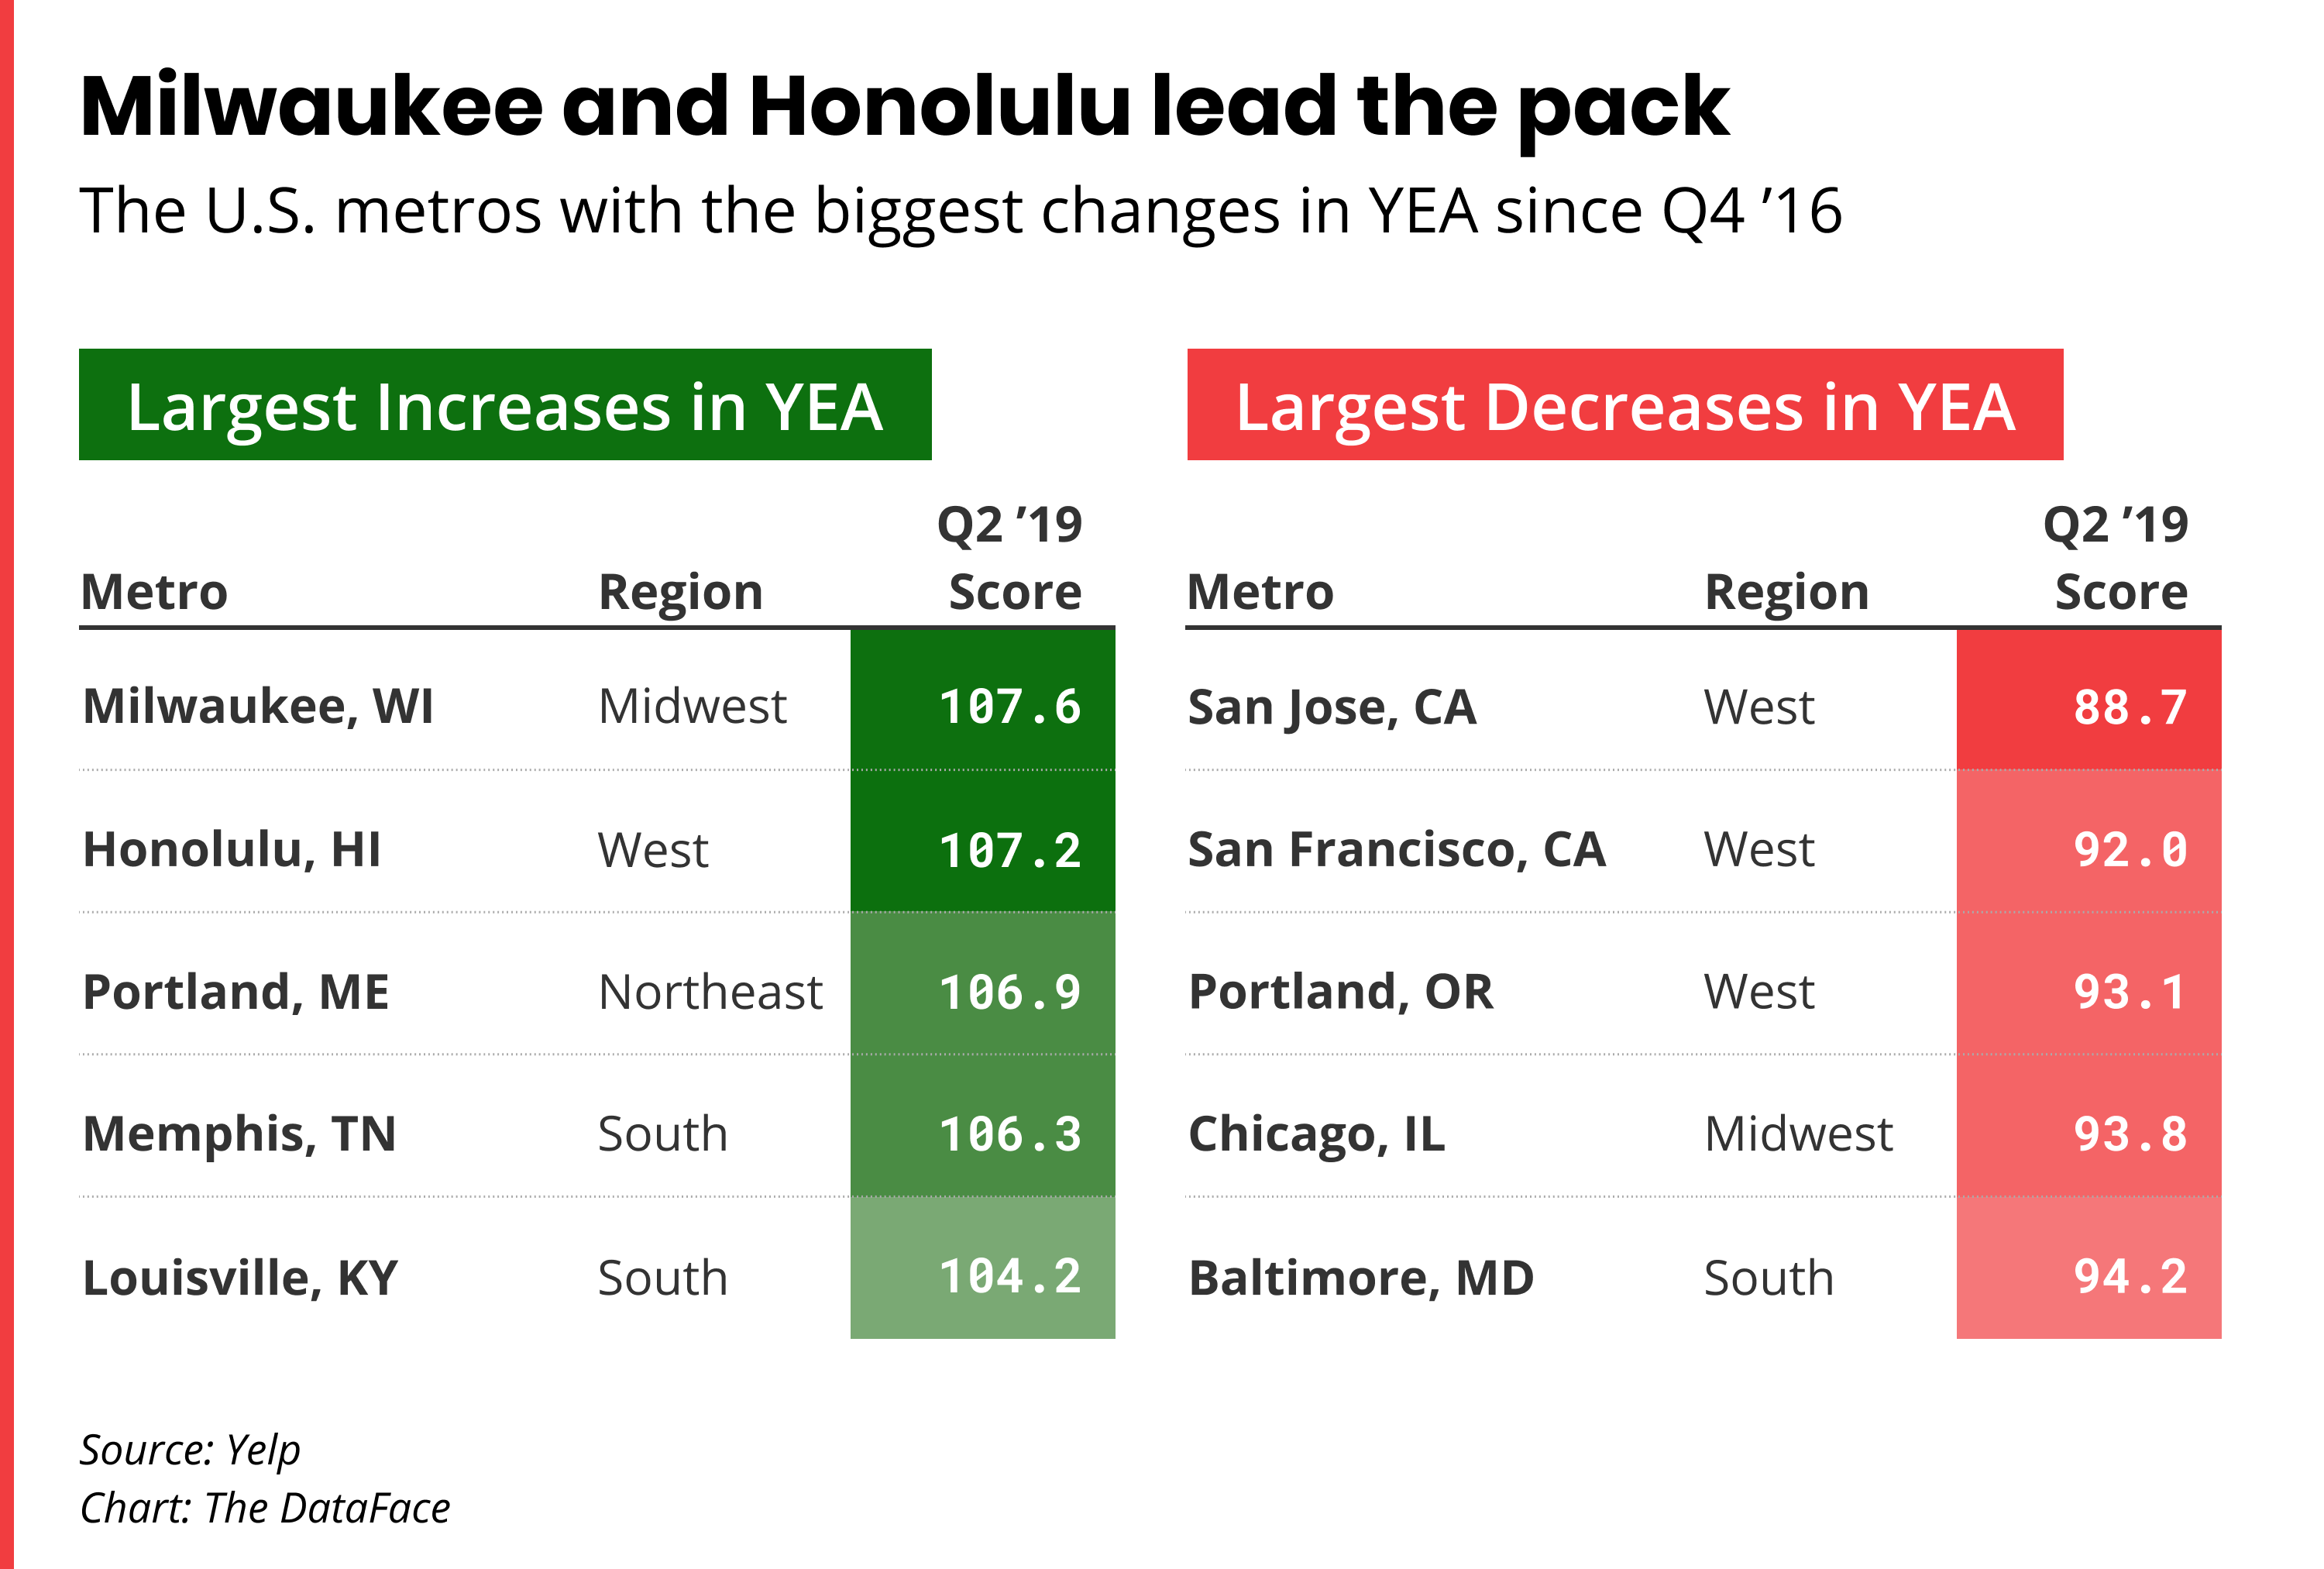
Milwaukee. Honolulu. Portland, Maine. Memphis. Louisville. These five cities anchor metro areas with the country’s strongest combination of business growth and consumer demand, according to the Yelp Economic Average — an economic indicator that uses Yelp data to track the U.S. local economy and 50 top metros around the country.
Far from the biggest and richest urban areas on both coasts, these five metros are thriving for a variety of reasons, with some common ground. All have struck gold in real estate related business—agents, lawyers, services—indicative of a boom in development, sometimes aided by permissive local laws.
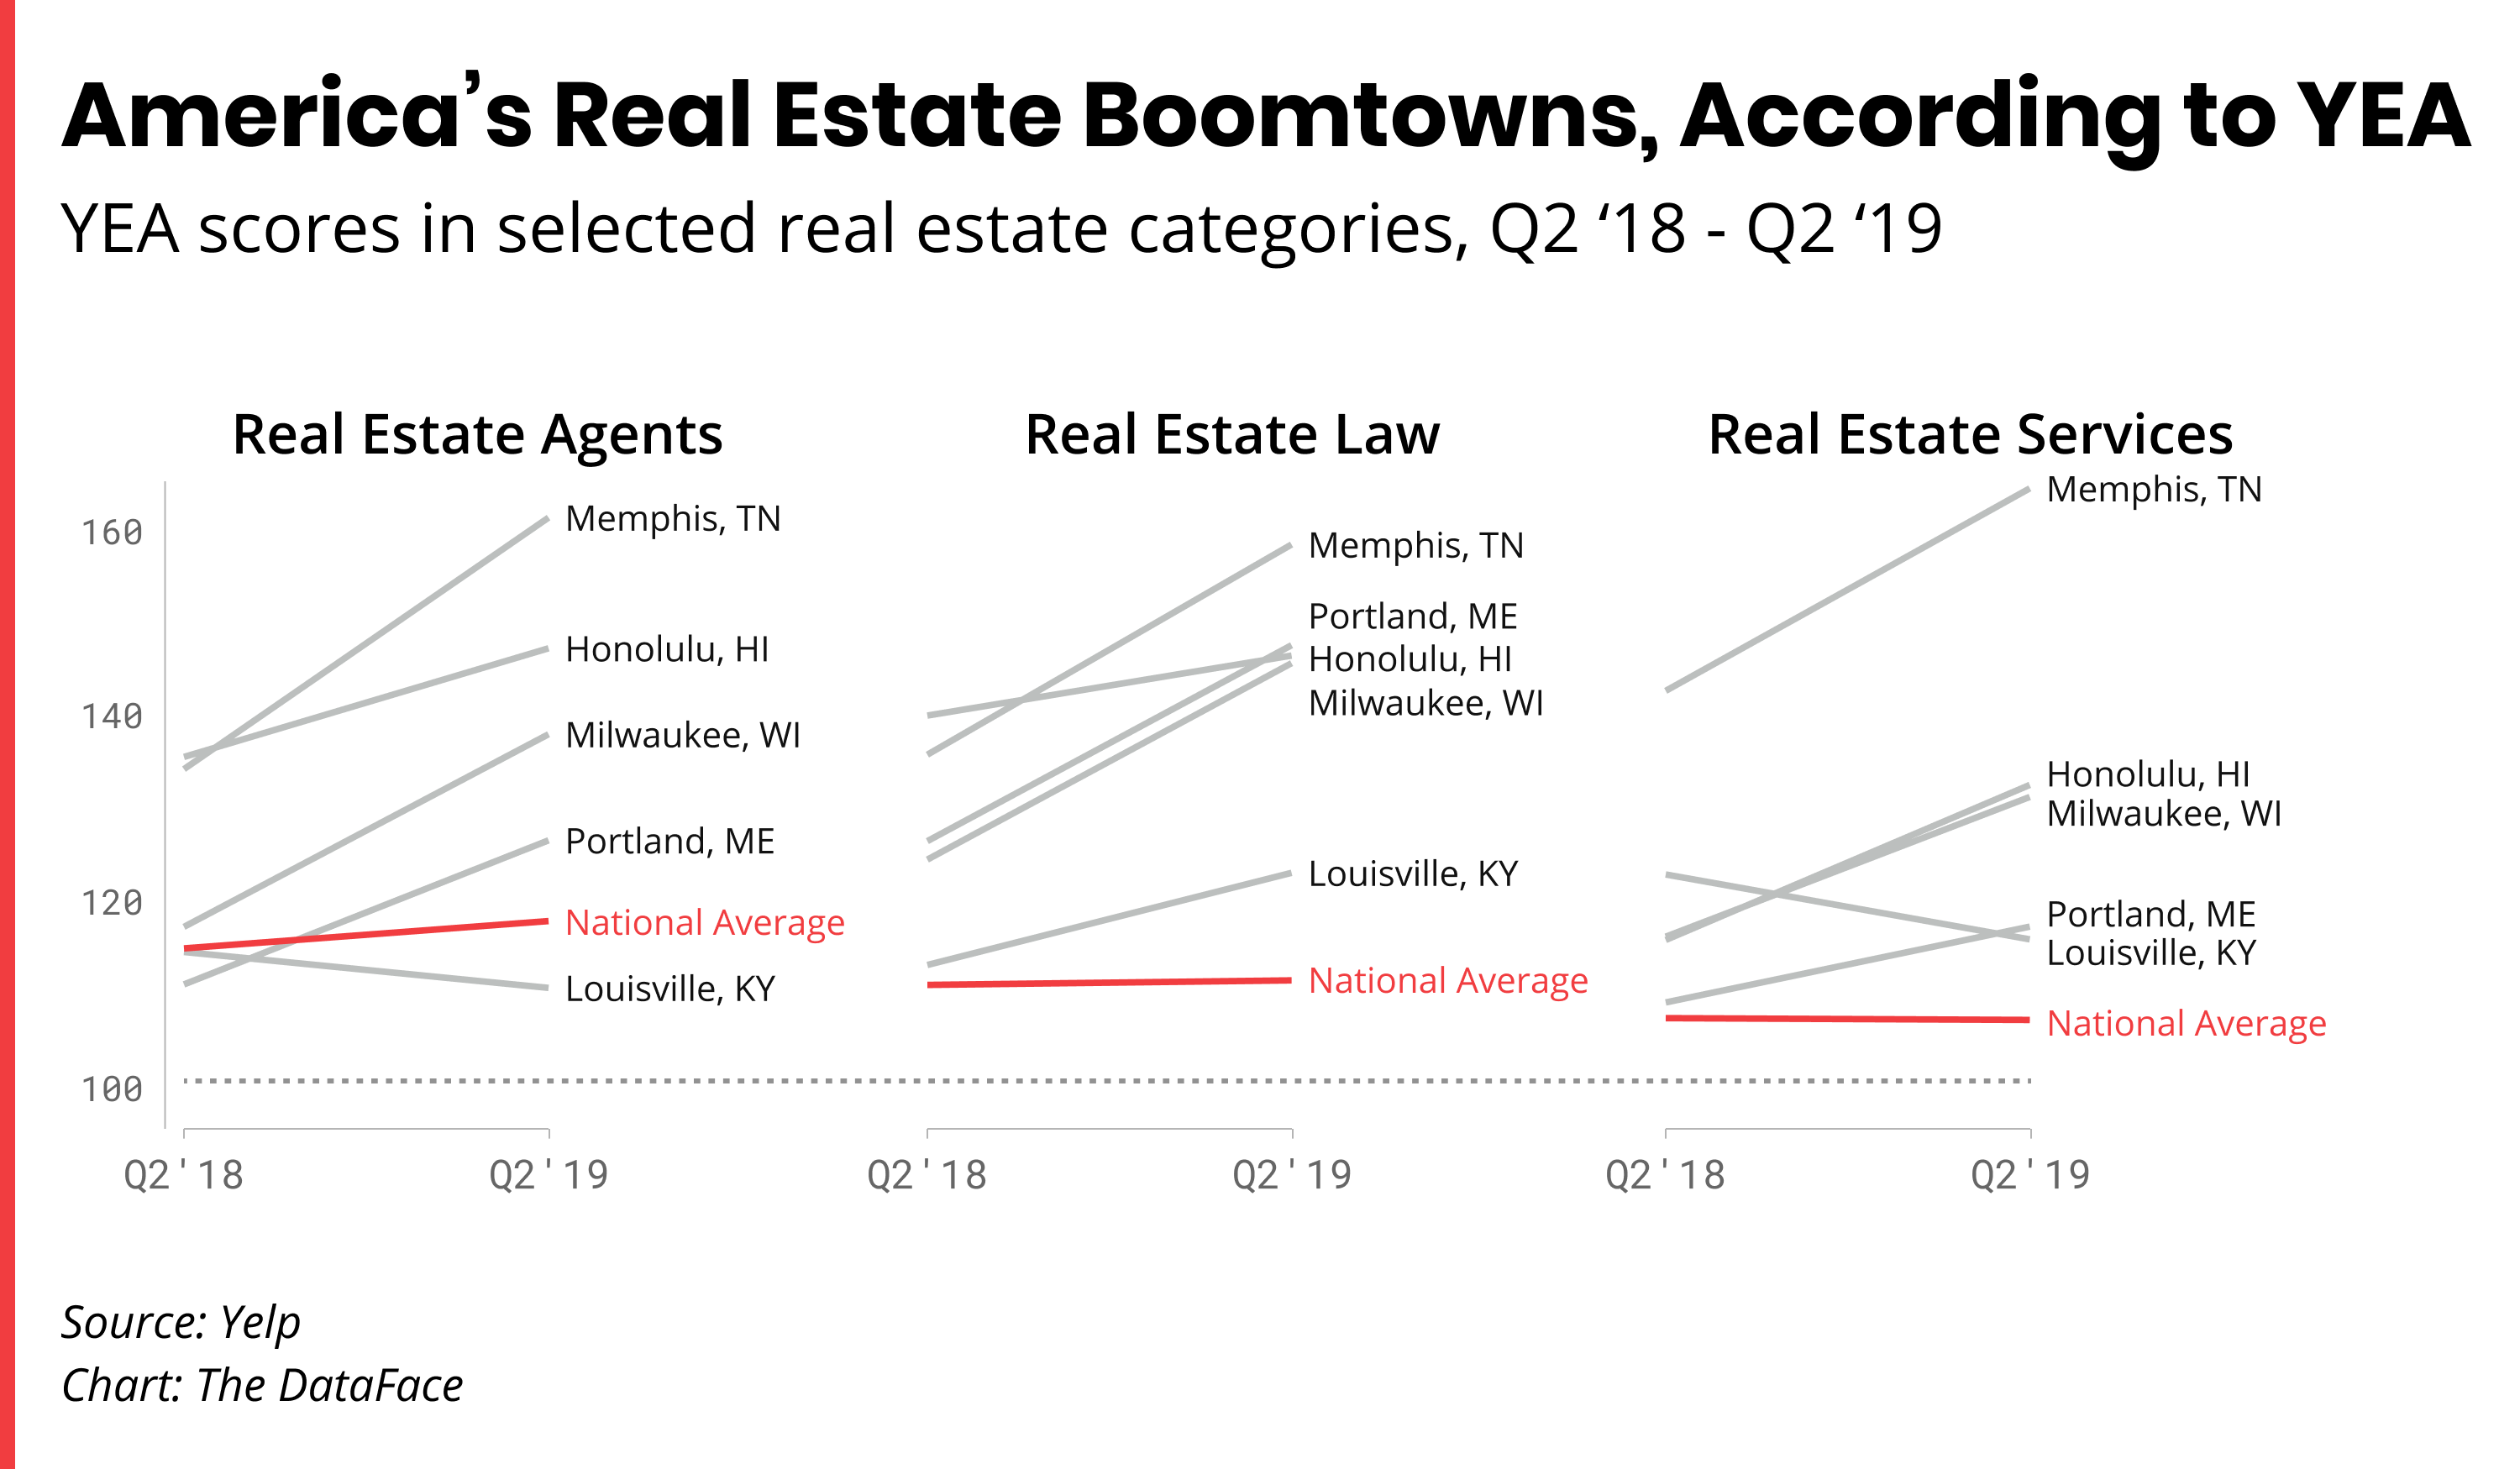
Milwaukee is benefiting from hosting privileges for next year's Democratic National Convention, and a new NBA arena. Developers are scrambling to meet demand for downtown housing in Memphis. And Portland is drawing people from out of state, driving up residential permits. Development is among the factors driving growth in the five Yelp boomtowns, the fastest growing metros since our measurement of their local business health began in the fourth quarter of 2016.
Meanwhile, some of the most sluggish local economies are wealthy metro areas on the West Coast that have resisted development amid a national debate about how much to build: Portland, Oregon; San Francisco; and San Jose all are among the bottom five metros for growth.
The five boomtowns with thriving small businesses are bucking the national trend: a sluggish local bricks-and-mortar economy across sectors from auto repair to sporting goods, down 0.2% from the first quarter, reversing a brief and modest recovery. And it's a very different picture than the one painted by some official government figures, which show the overall U.S. economy setting new records every month for its longest ever recession-free streak.
Beyond the cooling brick-and-mortar economy, and our boomtowns and laggards, other patterns emerged in the second quarter. More Americans paid professionals to clean: their cars, their clothes, their carpets, their homes. Americans were also thirsty, boosting lounges, pubs, and sports bars. And more of them passed on dessert, skipping donuts and ice creams.
Restaurants, Food, and Nightlife
Professional Services
Home Services
Local Services
Automotive
Shopping
We’re evaluating cities and the national economy using the Yelp Economic Average (YEA)—a measure of the health of important sectors across the U.S. economy, based on Yelp’s unique data set. We’ve calculated YEA from the fourth quarter of 2016, nationally and for 50 metros, and it shows which metros are thriving or struggling in consumer demand and business growth.
Yelp has information not only on millions of U.S. brick-and-mortar businesses but on the consumer demand expressed by the millions of consumers who use Yelp every day, which researchers have found makes us well positioned to accurately and quickly measure a huge swath of the economy that is missed by many major indicators.
The YEA counts strength using two signals: business survival and consumer interest. The opening of new businesses and an increase in consumer engagement both boost the YEA.
Methodology: The Yelp Economic Average (YEA) is a composite measure of the economy, reflecting both business health and consumer demand among businesses in 30 sectors.
The eight root categories
The 30 business sectors, or categories — the "Yelp 30″ — are drawn from eight umbrella business categories on Yelp: restaurants, food, nightlife, local services, automotive, professional services, home services, and shopping.
Root categories' share of the 30 components
The share of YEA components from each of these eight categories is based on each one's share of the economy, as estimated from County Business Patterns reports.
Choosing the Yelp 30
Each of the Yelp 30 is chosen based on maximizing four criteria, relative to other candidates within its family of categories, as measured in the first quarter of 2016:
Choosing baseline categories
We then chose baseline categories against which to compare the fortunes of the Yelp 30. This step helps remove changes due to seasonality and Yelp’s internal growth; what remains is a reflection of real economic patterns. We selected all other root categories not represented by the YEA components as baselines because they provided the most robust controls against seasonality and activity on Yelp.
Calculating the YEA scores
For each of the Yelp 30 in each quarter, its two scores — one for business population and one for consumer interest — are calculated as follows:
Then the two scores are normalized to have the same variance, so that each contributes equally across components.
To reduce the effect of outliers, the overall score for both consumer engagement and business count is the median of each component’s score.
The YEA is the mean of the overall consumer engagement score and business-count score.
The YEA is separate from, and not meant to inform or predict, Yelp’s financial performance because our figures are adjusted to remove the effects of changes to usage of our product.
We calculated equivalent scores at the regional and metro level to provide a local look at the state of the local economy.