
Carl Bialik
Data Editor
January 2019
Q4 2018
From sandwich makers to sporting-goods sellers, business sectors throughout the economy are slumping, according to Yelp data.
Most U.S. businesses are small businesses. How are they doing? Until now, it’s been hard to say. Today’s data resources for measuring economic health generally either focus on giant corporations or move at a glacial pace. Yelp has information not only on millions of U.S. businesses but on the consumer demand expressed by our 34 million monthly app users and 75 million monthly mobile web users, which researchers have found makes us well positioned to accurately and quickly measure a huge swath of the economy that is missed by many major indicators.
We’re making this information available today with the release of our Yelp Economic Average (YEA), a new benchmark of economic strength. For 30 representative categories of businesses, we combine consumer demand on Yelp with openings and closings of businesses to calculate YEA.
Restaurants, Food, and Nightlife
Professional Services
Home Services
Local Services
Automotive
Shopping
Over the past quarter, YEA fell by more than two points, due in large part to declines in the professional services, shopping, and other categories. Slumps in core business sectors may be early signs of an economic downturn. A second successive fourth-quarter slump isn’t a result of seasonality; we’ve normalized the data so that it is seasonally adjusted.
Of the 30 business sectors represented by the Yelp Economic Average (YEA), only one—gas stations—saw an increase in the fourth quarter of 2018, resulting in a national decline to 98.5 from 100.7 in the third quarter. All YEA scores are calculated relative to the fourth quarter of 2016, for which the score was set to 100.
The downturn left few business sectors untouched. Everything from high-end retail such as jewelry stores and antique shops to pricey professional services such as private eyes and architects were hit hard in the fourth quarter, in a trend extending to sectors beyond our core 30. So were more routine discretionary offerings, such as burger places, bars, and coffee shops.
The handful of sectors to buck the trend and rise in the quarter includes self-storage facilities, which can be countercyclical, thriving when people downsize homes or need to upsize homes but can’t.
Amid all the declines, a few in particular caught our eye. Here’s our best guess about what could be driving the change.
With marriage rates remaining well below previous generations’, and the newest newlyweds staying together longer, one line of business that caters to married people is struggling: divorce law. The category was down six-tenths of a point last quarter, though it remains strong in the Midwest, with a 5.4-point increase in the region.
Divorce & Family Law
Yelp Economic Average by U.S. metro, Q4 2018
West Midwest Northeast South
Sandwiches and baked goods also are struggling, with fourth-quarter dips exacerbating long-term declines. Low-carb diets remain popular despite mixed scientific findings, while the increased availability of gluten-free foods may be taking consumers away from their traditional sources for bread-based products.
Sandwiches
Yelp Economic Average by U.S. metro, Q4 2018
West Midwest Northeast South
As more Americans spend more time on their phones accomplishing a greater number of tasks, that’s hit businesses that sell computers and ones that sell computer-repair and IT services—two of the 30 sectors included in YEA.
IT Services & Computer Repair
Yelp Economic Average by U.S. metro, Q4 2018
West Midwest Northeast South
You can explore more data about performance by business sector in our interactive visualization:
Explore Other Business Sectors
Yelp Economic Average by U.S. metro, Q4 2018
West Midwest Northeast South
Yeah, we’ve made something a little different than well-known economic scores. The Dow Jones Industrial Average, the Standard & Poor’s 500 Index, the Nasdaq Composite Index, and other stock indexes measure the value of companies so big that they’re owned publicly. The Gross Domestic Product bundles the local consumer economy with business-to-business commerce and national and multinational firms.
YEA, by contrast, is a measure of the Yelp economy, which underpins the local economy. A successor to Yelp’s long-running Local Economic Outlook, YEA is inspired by the major stock indexes. They track the stocks of major companies while YEA tracks the fortunes of businesses in 30 important sectors on Yelp, drawn from the pillars of the Yelp economy: restaurants, retail, and service companies. On Yelp, people join the waiting list remotely at places to buy sandwiches, and request quotes from companies that can clean their offices. Both types of businesses are represented in our index.
Taking a page from the basket of goods used to calculate inflation for the Consumer Price Index, Yelp’s data scientists have identified a basket of other businesses, chosen for their sectors’ representativeness and consistency, to form a baseline against which the Yelp 30 are being compared.
YEA counts success using two signals: business survival and consumer interest. The opening of new businesses and an increase in consumer engagement both boost YEA.
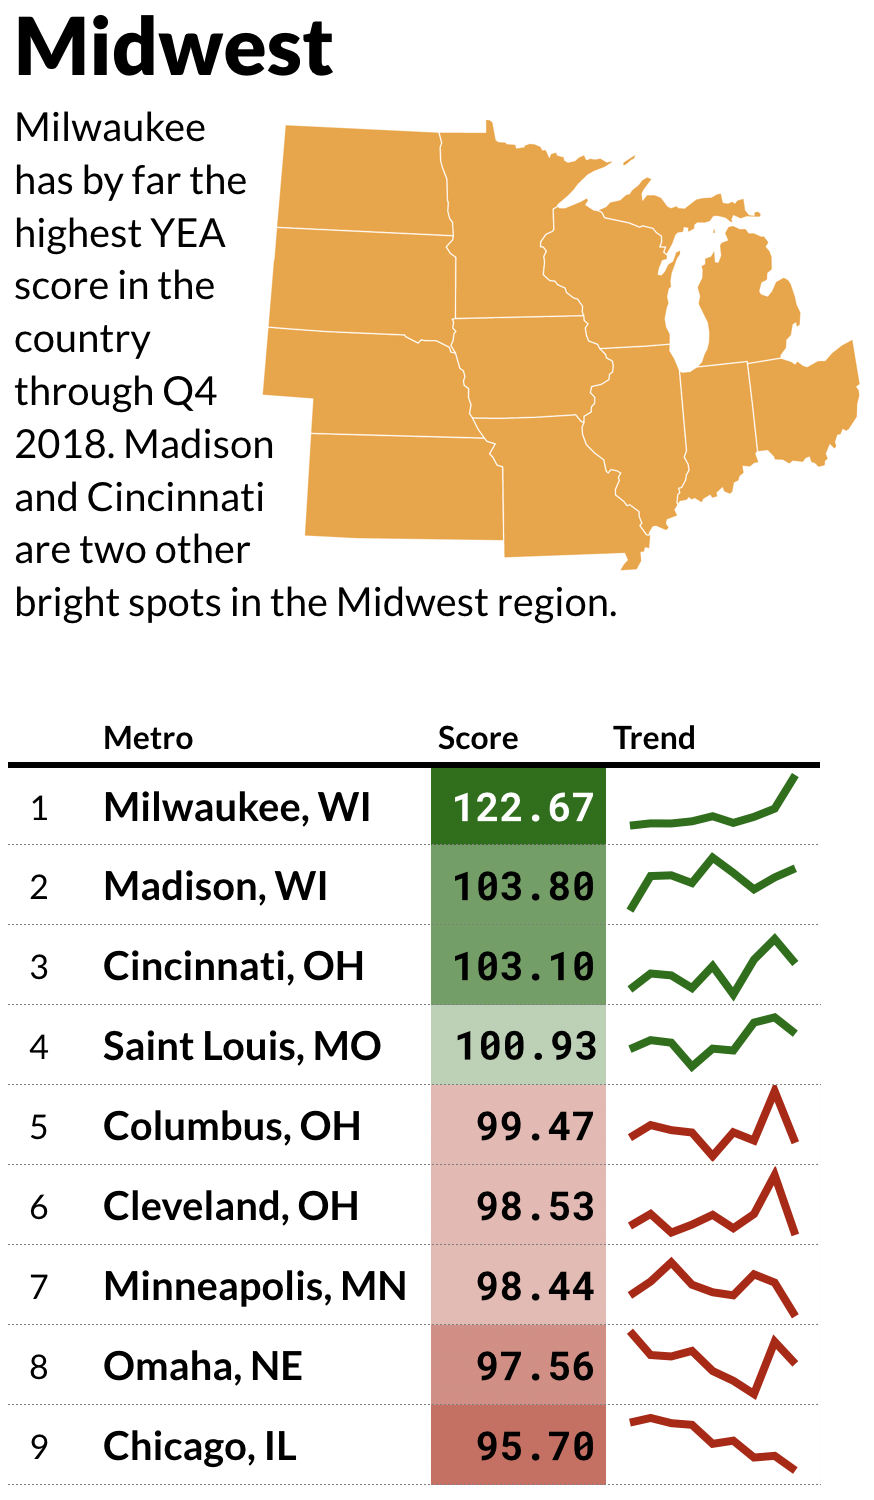
Milwaukee and Albuquerque were among the few cities gaining in the latest quarter, as Milwaukee’s commercial real estate sector is booming and Albuquerque is riding the New Mexico economic surge.
Economic Growth is Distributed Across the U.S.
A look at the Yelp Economic Average for each region's top metros
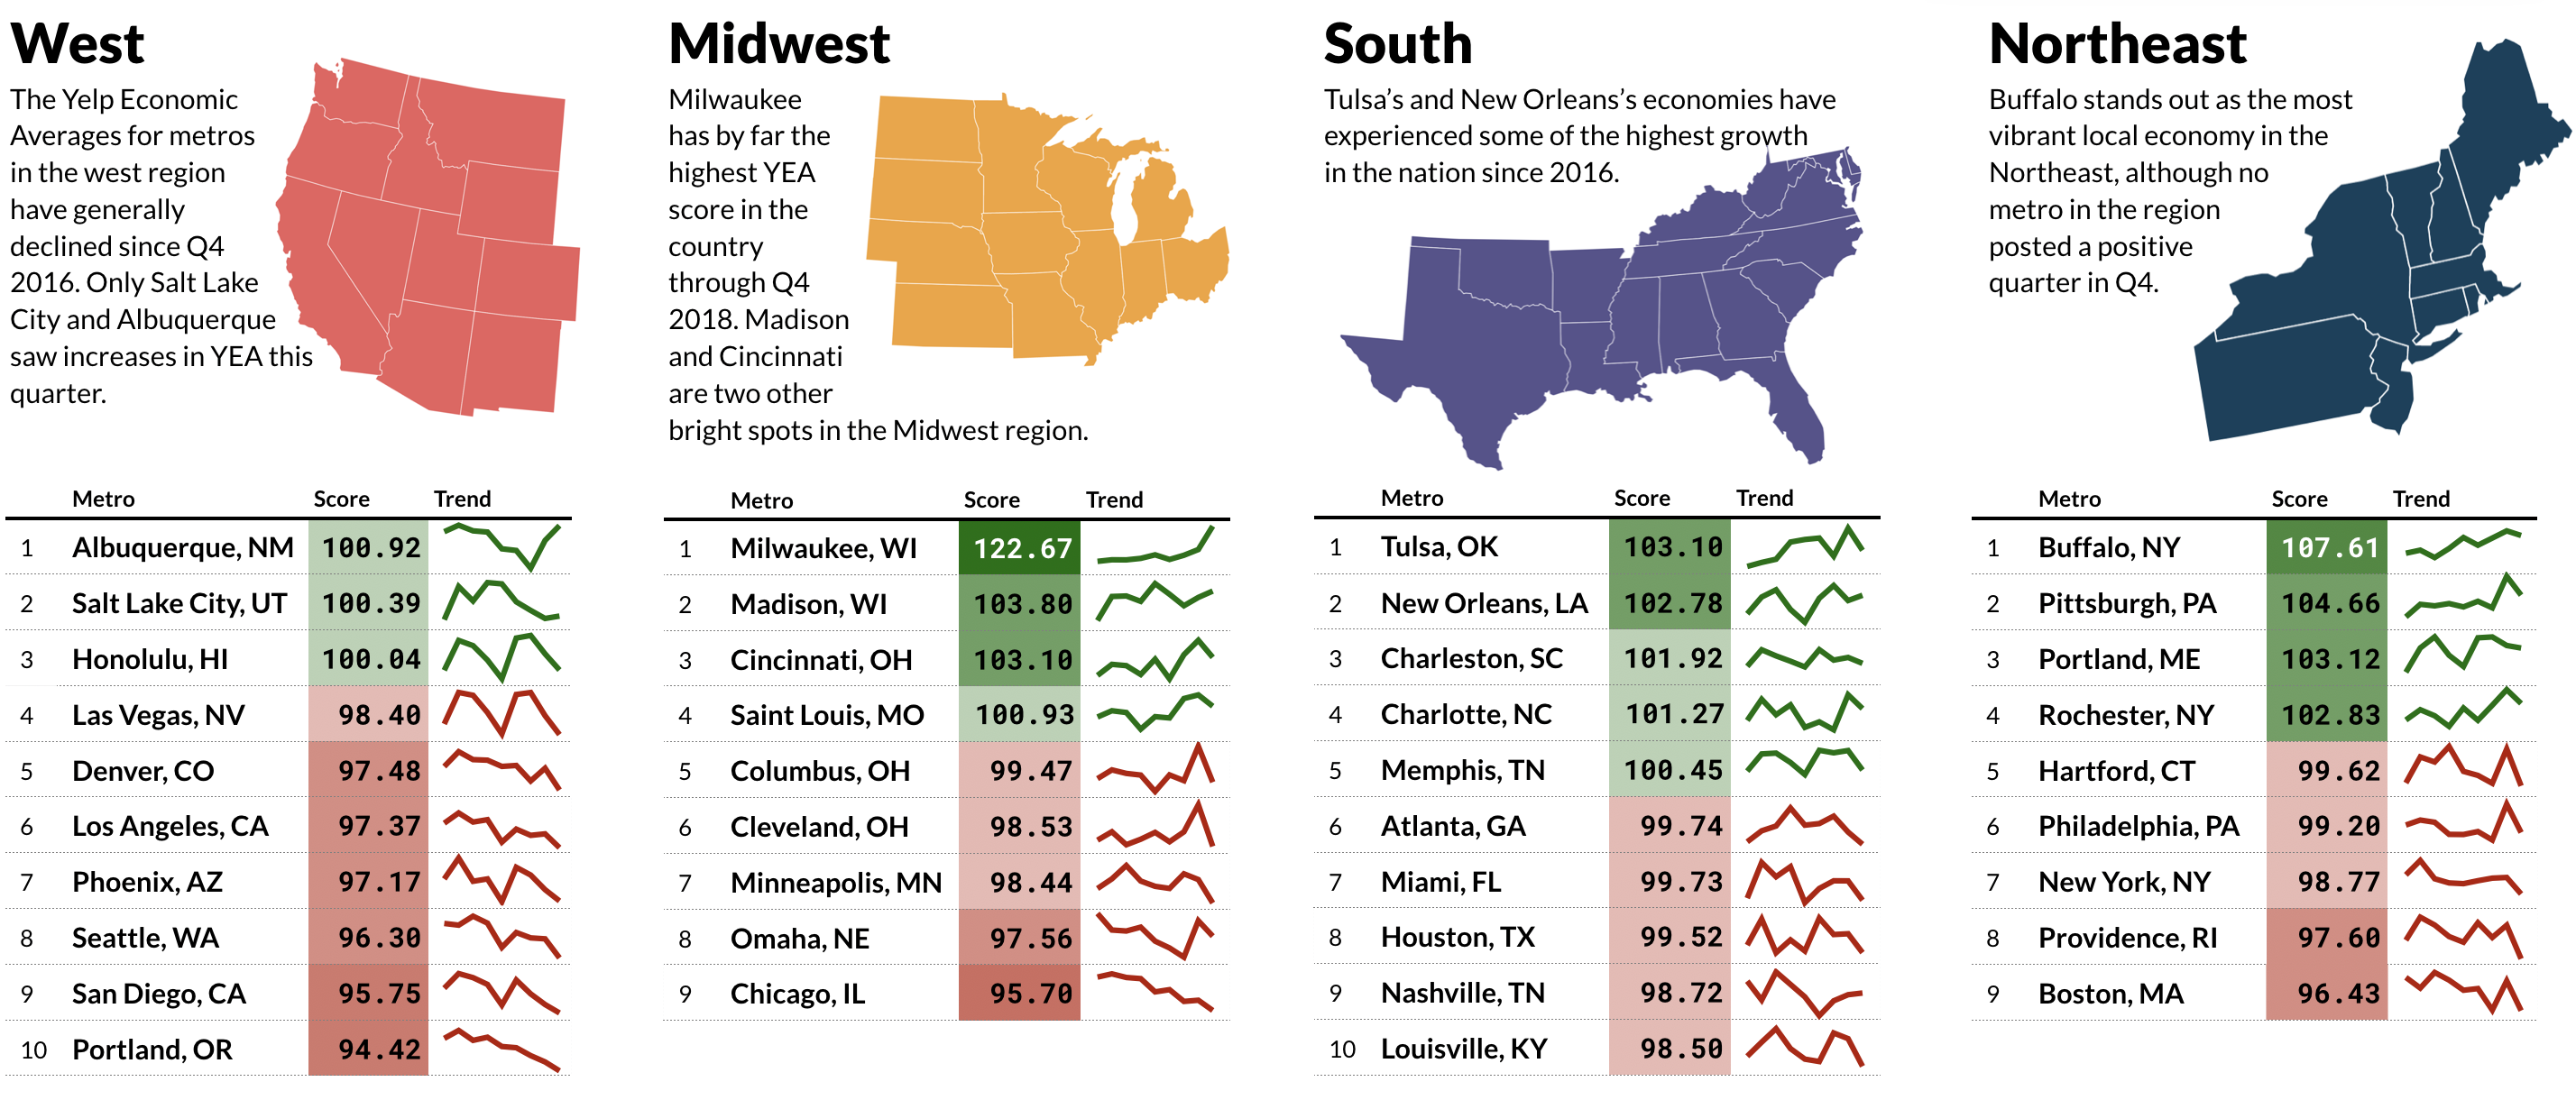
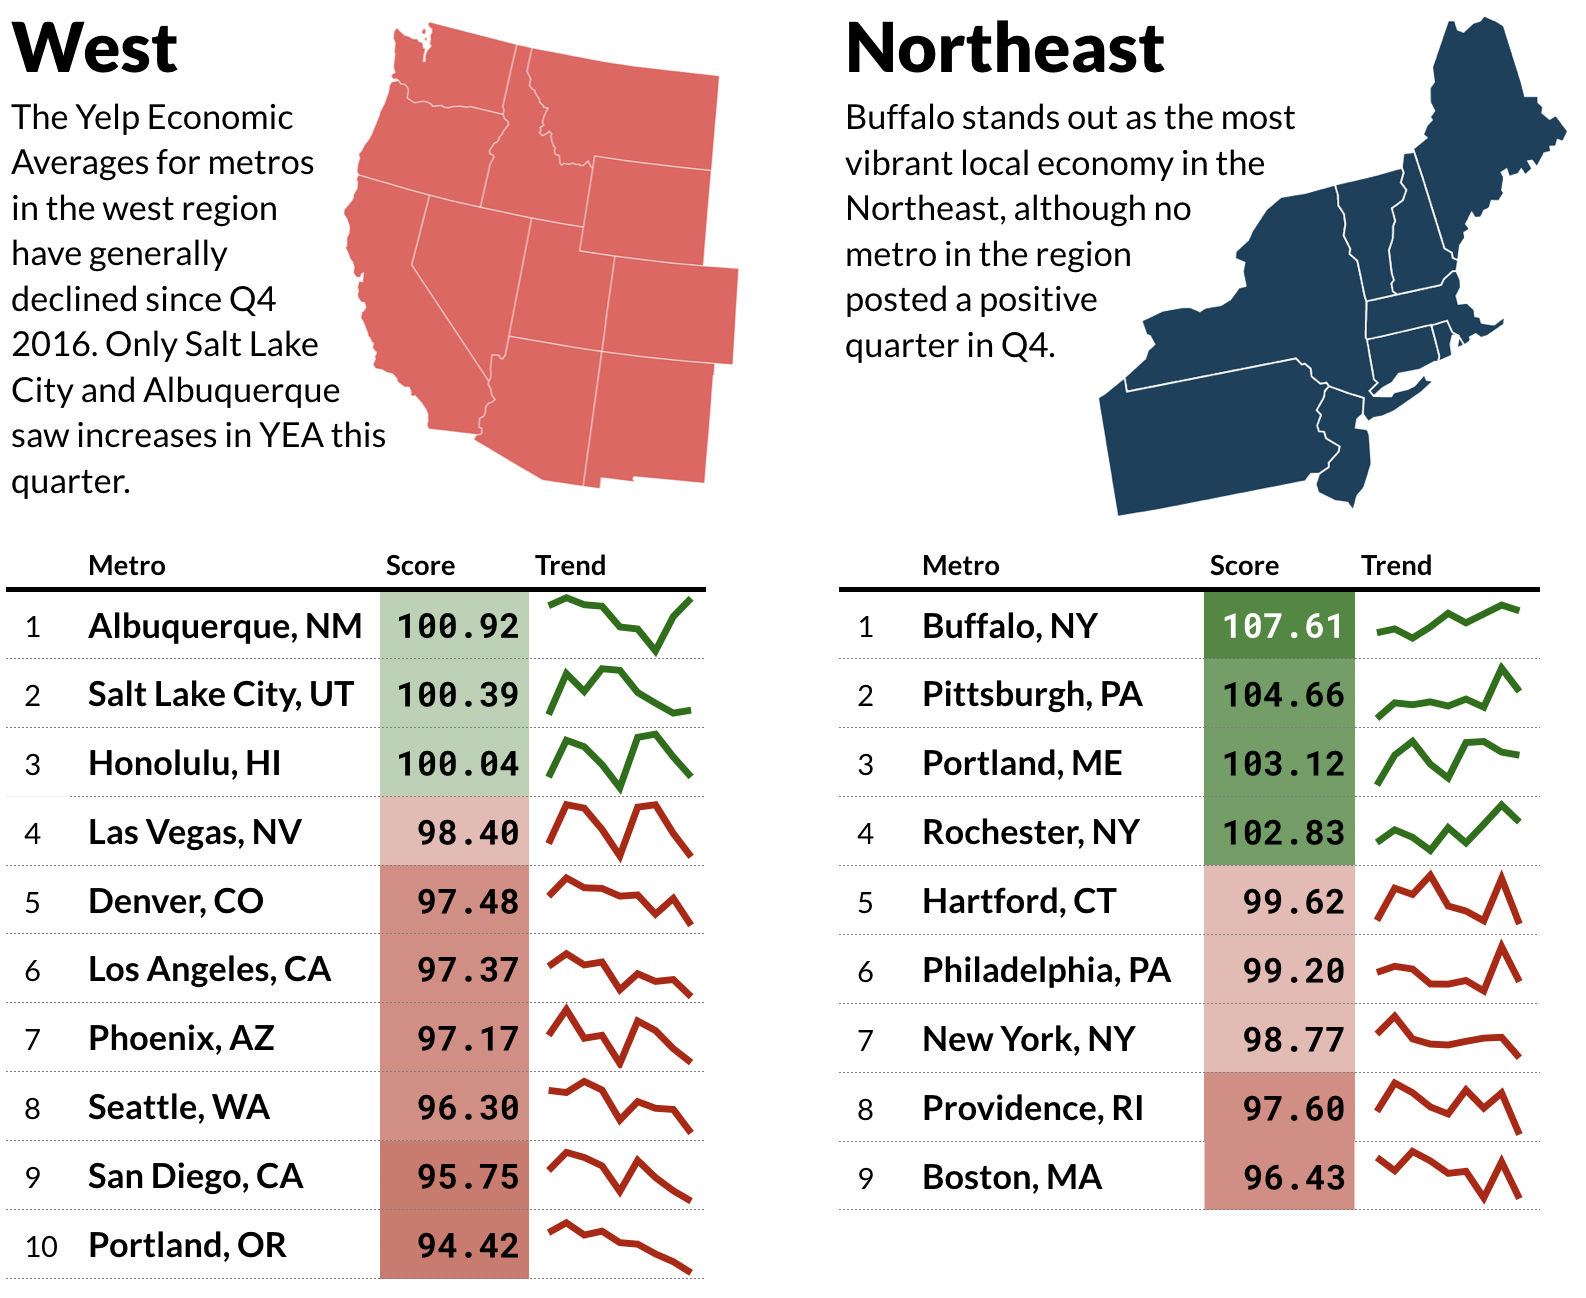
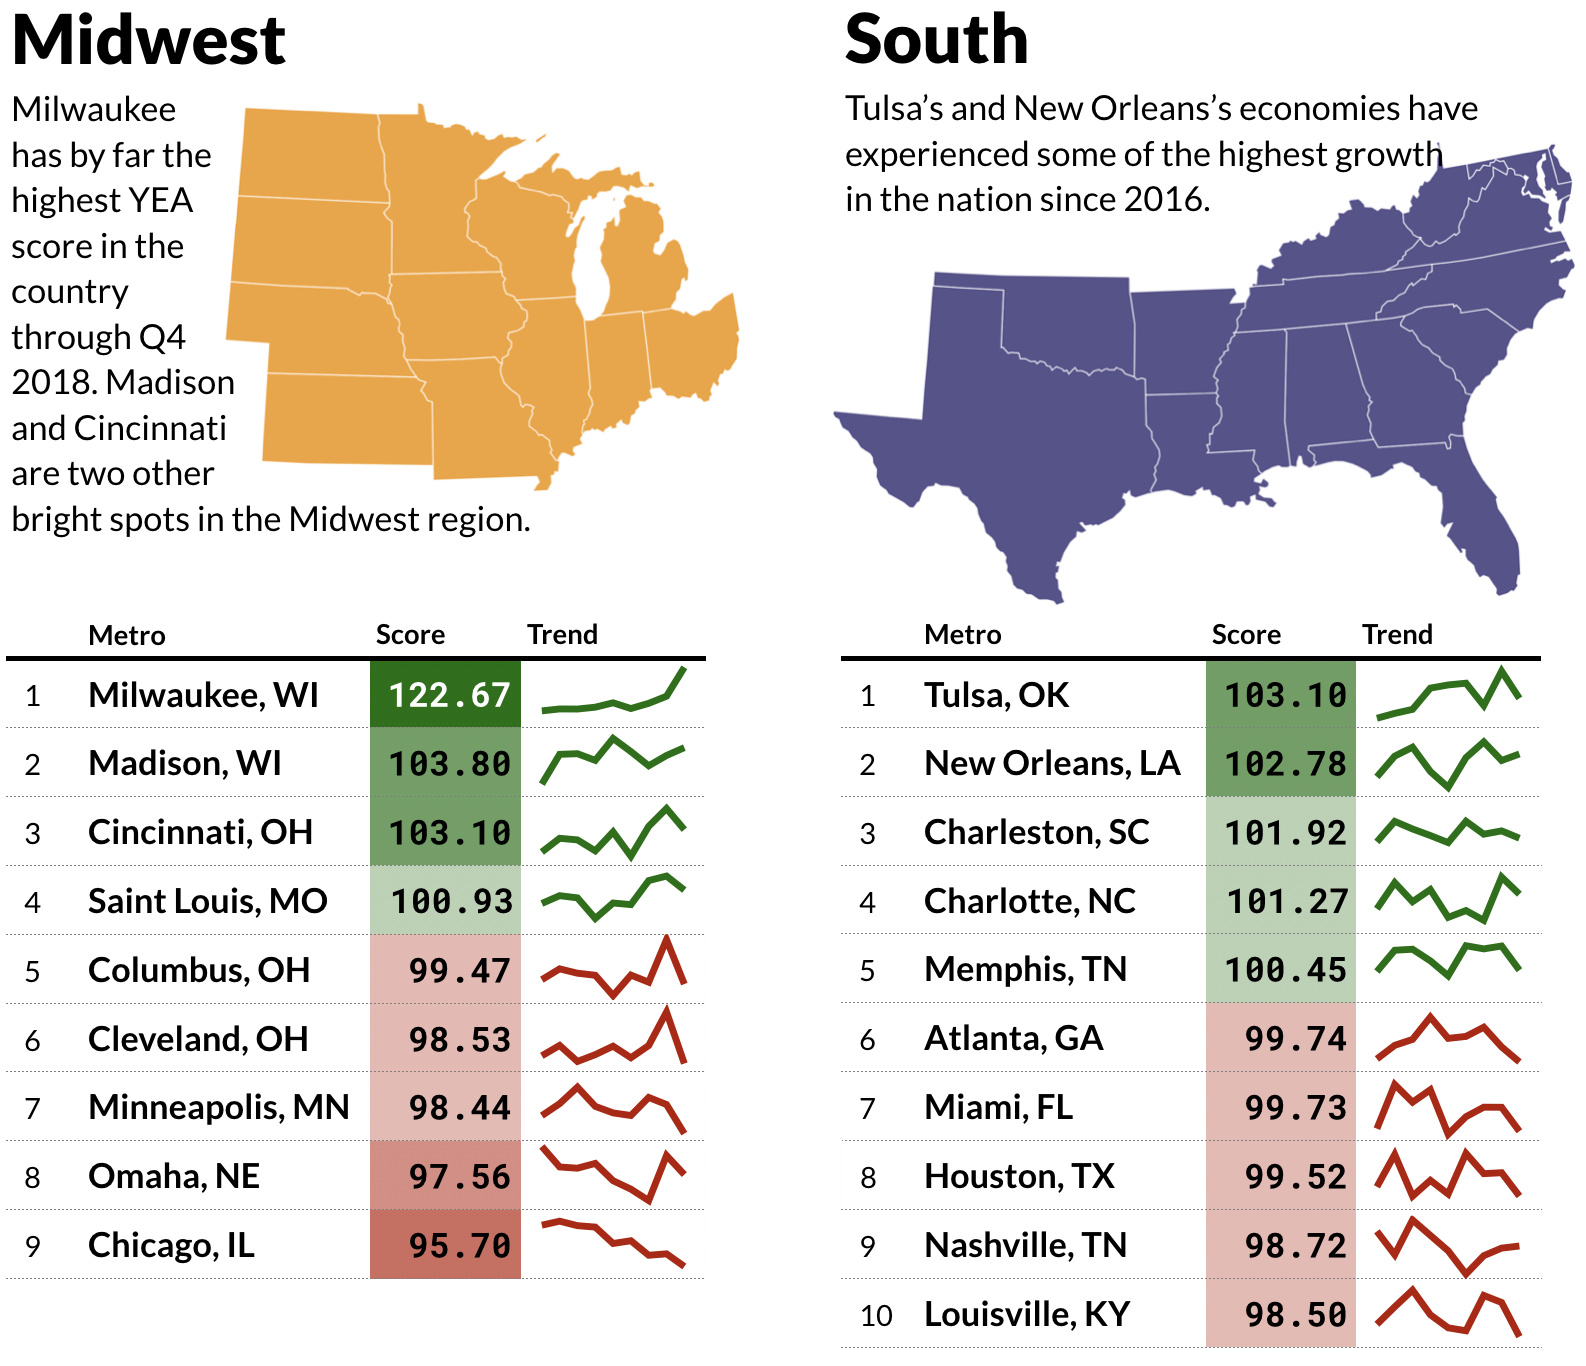
YEA’s decline in the third and fourth quarters reversed gains in the prior two quarters, across the country and in most categories.
YEA is part of a larger project to surface insights from Yelp’s data to help businesses succeed and provide policymakers with information to boost their economies.
Methodology: The Yelp Economic Average (YEA) is a composite measure of the economy, reflecting both business health and consumer interest among businesses in 30 sectors.
The eight root categories
The 30 business sectors, or categories — the "Yelp 30″ — are drawn from eight umbrella business categories on Yelp: restaurants, food, nightlife, local services, automotive, professional services, home services, and shopping.
Root categories' share of the 30 components
The share of YEA components from each of these eight categories is based on each one's share of the economy, as estimated from County Business Patterns reports.
Choosing the Yelp 30
Each of the Yelp 30 is chosen based on maximizing four criteria, relative to other candidates within its family of categories, as measured in the first quarter of 2016:
Choosing baseline categories
We then chose baseline categories against which to compare the fortunes of the Yelp 30. This step helps remove changes due to seasonality and Yelp’s internal growth; what remains is a reflection of real economic patterns. We selected all other root categories not represented by YEA components as baselines because they provided the most robust controls against seasonality and activity on Yelp.
Calculating the YEA scores
For each of the Yelp 30 in each quarter, its two scores—one for business population and one for consumer interest—are calculated as follows:
Then the two scores are normalized to have the same variance, so that each contributes equally across components.
To reduce the effect of outliers, the overall score for both consumer engagement and business count is the median of each component’s score.
YEA is the mean of the overall consumer engagement score and business-count score.
We calculated equivalent scores at the regional and metro level to provide a local look at the state of the local economy.