
Q3 2020
Yelp Economic Average Shows New Restaurant and Food Businesses are Opening, Business Reopenings Rise Across the Country
For the Q3 2020 Yelp Economic Average report, we’re using a new methodology that tracks several indicators on a daily basis. For more on the methodology for this report, click here.
COVID-19 has tested businesses. It has tested their resiliency, their dedication and their creativity, but businesses have risen to the challenge. In our last Economic Impact Report we reported that many businesses have sadly been forced to shut their doors, in some cases permanently. However, business closures alone don’t tell the full story. While our Economic Impact Report and the latest unemployment figures show continued economic uncertainty, our data finds that some areas of the local economy are showing promising signs of adaptability.
In a display of tremendous resilience, many local economies are reopening, and even amid setbacks and delayed reopening plans businesses have persevered – many with new operating models and services. Restaurants and food businesses, an industry hit hard by the pandemic, have seen a significant number of brand-new business openings amid the increased challenges. These openings and reopenings have been sustained by focusing on health and safety, as well as new approaches to serve their customers, including moving their services and patrons outdoors. Relatedly, consumers have been spending more time outside, reflected in an increase in interest for outdoor related service providers and leisure activities, as well as outdoor dining.
New Restaurant and Food Businesses Continue to Open Amid a Challenging Economy
Yelp data shows there’s a significant number of entrepreneurs opening up restaurants and food businesses at this point in the pandemic. Opening a restaurant is no easy feat under normal economic circumstances, yet it’s happening during the pandemic at a higher rate than one might expect. Yelp’s data indicates that the number of restaurant and food-based business openings are increasingly more in line with 2018 and 2019 volumes with every passing month. Openings are determined by counting new businesses listed on Yelp.
One would be hard-pressed to find new restaurants opening with elaborate fine dining interiors, but pandemic-optimized eateries are opening, debuting some combination of features such as large patios, spaced out tables, order ahead menus, and efficient service cuisine. Compared to Q3 2019, Yelp observed an increase in brand new openings in Q3 2020, nationally, for open air food services including: farmers markets (211 openings) and food trucks (1,734 openings). In addition, pop-up restaurants (100 openings) and seafood markets (84 openings) experienced an increase in openings from 2019, catering to consumers' interests in novel ways to dine and shop for food outside of traditional restaurant experiences. Yelp data indicates openings increased for food businesses that specialize in sweet treats that are often enjoyed at home or sent to friends and family for socially distanced celebrations, including cupcakes (494 openings), custom cakes (512 openings), and desserts (1,615 openings).
Unsurprisingly, in April, restaurants endured a large drop in new openings, however in May a rebound had already begun, with a 29% average monthly increase of new restaurant openings from May to July. New restaurant openings have stayed relatively flat in August and September, with approximately 6,600 new restaurants opening each month. There were only 100 fewer new restaurant openings in September of this year, compared to September 2019. New restaurant openings in Q3 are only down 10% compared to Q3 2019.
New Restaurant and Food Businesses are Opening at Pre-Pandemic Levels
New restaurant and food business openings*, 2016 - 2019 vs. 2020
Yelp measures community resilience by comparing the rate of change of new openings in Q3 relative to Q2, removing seasonal impact. Community resilience determines how well states have rallied to open new businesses in Q3 compared to Q2 during the pandemic. States that showed the most resilient third quarter for restaurant and food-related business openings include North Dakota (39 openings), Washington D.C. (108 openings), Rhode Island (69 openings), New Hampshire (103 openings), and Wyoming (34 openings) — all with at least 2X the openings in Q3 compared to the previous quarter. States with the largest total number of new openings in Q3 tend to be larger and heavily populated, including California (3,279 openings), Texas (2,002 openings), Florida (1,542 openings), New York (1,420 openings), and Washington (561 openings).
The Rate of New Restaurant and Food Business Openings Vary by State
Community resilience* compares new restaurant and food business openings in Q3 to Q2 2020
Resilience
More new openings in Q3, relative to Q2
Business Reopenings Rise Across the Country in Q3
Amid a year of unprecedented challenges for U.S. small businesses, more than 210,000 have proved their resilience through this extraordinarily difficult period by reopening after an extended temporary closure (between March 1 and September 30). Yelp analyzed the reopening trends in each state by comparing the change in reopenings month-over-month.
After the initial outbreak of the pandemic, business reopenings began in April when many states began to lift their stay-at-home orders in exchange for more lenient regulations. Nationally, Yelp data shows a sharp spike in business reopenings, month-over-month, of temporarily closed businesses in April and May followed by a decline in business reopenings in June and July – when cases climbed again across the nation. In August, when cases began decreasing and government entities loosened restrictions, more business reopenings followed, with a significant increase in business reopenings in September.
Business Reopenings Accelerated in September
Month-over-month change in business reopenings, April to September 2020
MoM Change
-75%
75%
While many states and metro areas followed this national trend, some show slight variations, as business reopening restrictions differed across the nation. States with the biggest increase in reopenings from April to May include: New Hampshire (78% increase), Ohio (40% increase), Kentucky (38% increase), South Dakota (31% increase), and Delaware (31% increase). Major metro areas that experienced the highest increases in reopenings from April to May include: Phoenix, AZ (23% increase), Las Vegas, NV (23% increase), Orlando, FL (21% increase), Denver, CO (19% increase), Tampa, FL (17% increase), and Detroit, MI (16% increase). These reopening trends reflect government guidelines with many smaller, Midwest and Southern cities experiencing less restrictive regulations than their Coastal counterparts. Florida opened all businesses at 50% capacity as early as June 5th, whereas cities such as New York, NY and Los Angeles, CA only reached the later stages of reopened in September; many businesses are still not operating at more than 25% capacity as of October.
Meanwhile, states with the biggest decrease in reopenings from April to May include: Oregon (45% decrease), Washington D.C. (42% decrease), Arkansas (31% decrease), Mississippi (23% decrease), and New York (22% decrease). States such as Arkansas and Mississippi experienced the majority of their reopenings in April, which likely slowed their rate of reopenings in May. Conversely, Oregon, Washington, D.C. and New York experienced longer shut-down orders due to upticks in cases. Cities closer to epicenters of the pandemic from April to May experienced the highest decreases in business reopenings, including Philadelphia, PA (31% decrease), New York, NY (21% decrease), San Diego, CA (19% decrease), San Francisco, CA (19% decrease), Seattle, WA (18% decrease) and San Jose, CA (16% decrease).
The only areas that increased reopenings from May to June were Washington, D.C. (40% increase) and Philadelphia, PA (19% increase) – Philadelphia shortly after endured a 53% decrease in reopenings from June to July. Philadelphia reopened at 50% capacity during May and June, but as a result of a surge in cases, restrictions were updated and the city enforced 25% capacity maximums, as well as updated their violation policies to include fines and forced closures.
As the pandemic continued and states responded to additional waves of COVID-19 cases across the country, June and July reopenings slowed across the nation compared to prior months. The only metropolitan area to increase in openings from June to July was Buffalo, NY (9% increase). Western New York, where Buffalo is located, entered into Phase 4 reopening as of June 30th, whereas the population epicenter of the state, New York City, only entered Phase 4 reopening as of September 30th.
Case containment responses as a result of the early summer spikes resulted in renewed momentum of reopenings in August and September. States that experienced a 30% or more increase in reopenings from July to August include: Louisiana (90% increase), Montana (86% increase), South Dakota (55% increase), North Dakota (50% increase), Iowa (34% increase), Indiana (35% increase), and Wisconsin (30% increase). These reopenings continued into September, when North Dakota, Alabama, Idaho, Wyoming, and Oregon experienced more than 3X the number of reopenings in September than in August.
While the average rate of reopenings have slowed overall since the initial reopenings phase in April and May, Yelp data shows businesses are continuing to reopen, particularly in September, as business owners adapt to changing local regulations and fluctuating COVID-19 infection rates.
Reopenings Increase Across Financial Services, Education, Active and Beauty Categories in the Third Quarter
Yelp’s September Local Economic Impact Report found that businesses in home, local, professional, and automotive services showed a lower closure rate than restaurant and retail businesses. Now, Yelp’s reopening data supports a resurgence in demand for categories that were previously pushed to temporarily close.
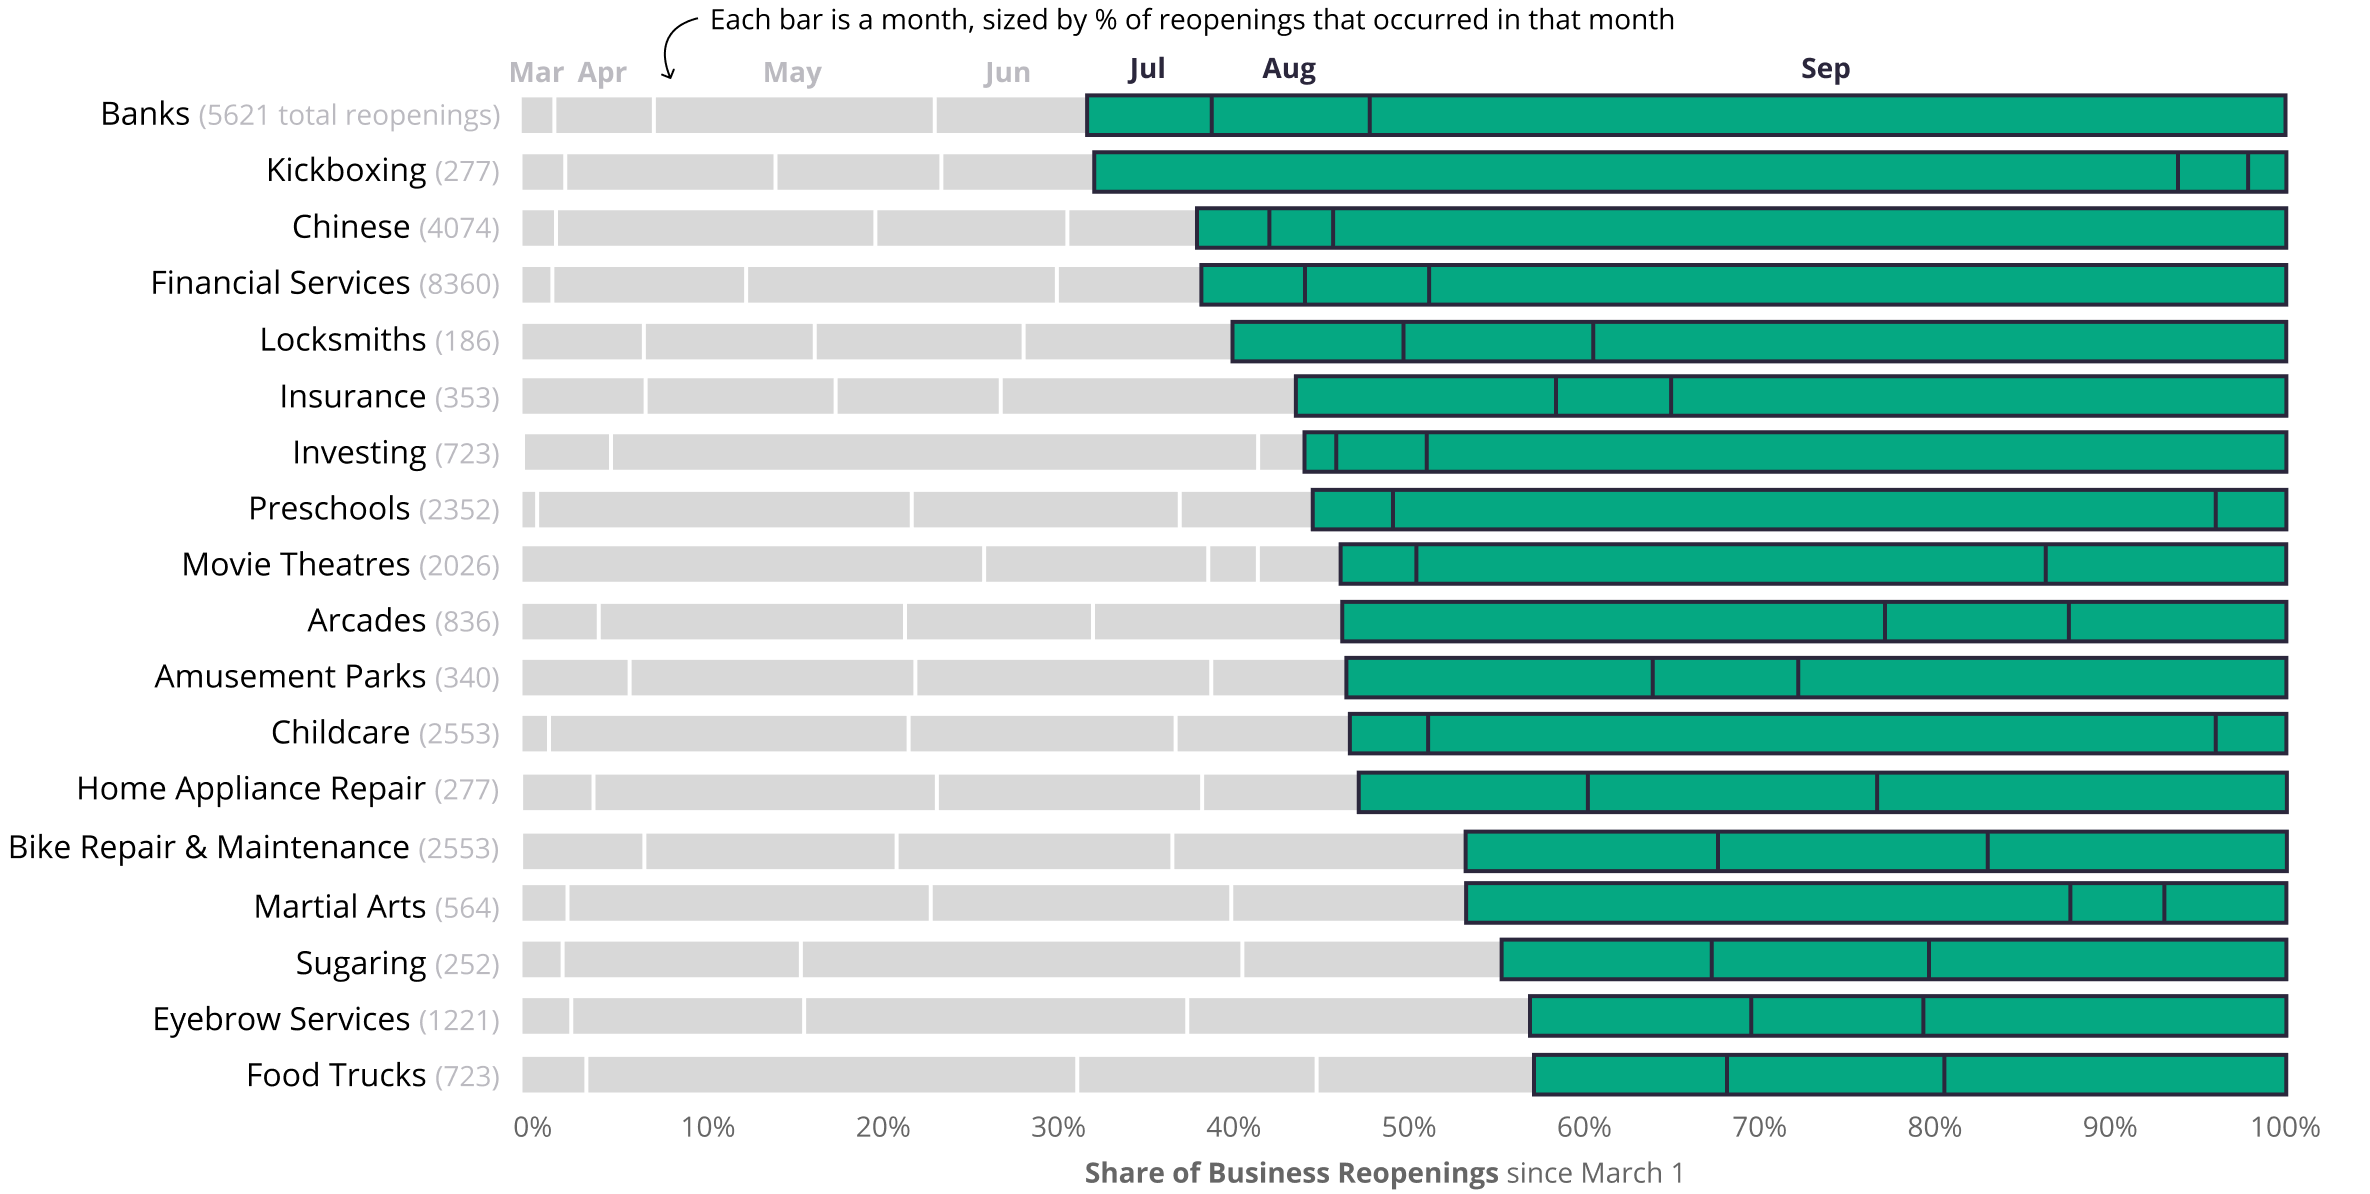
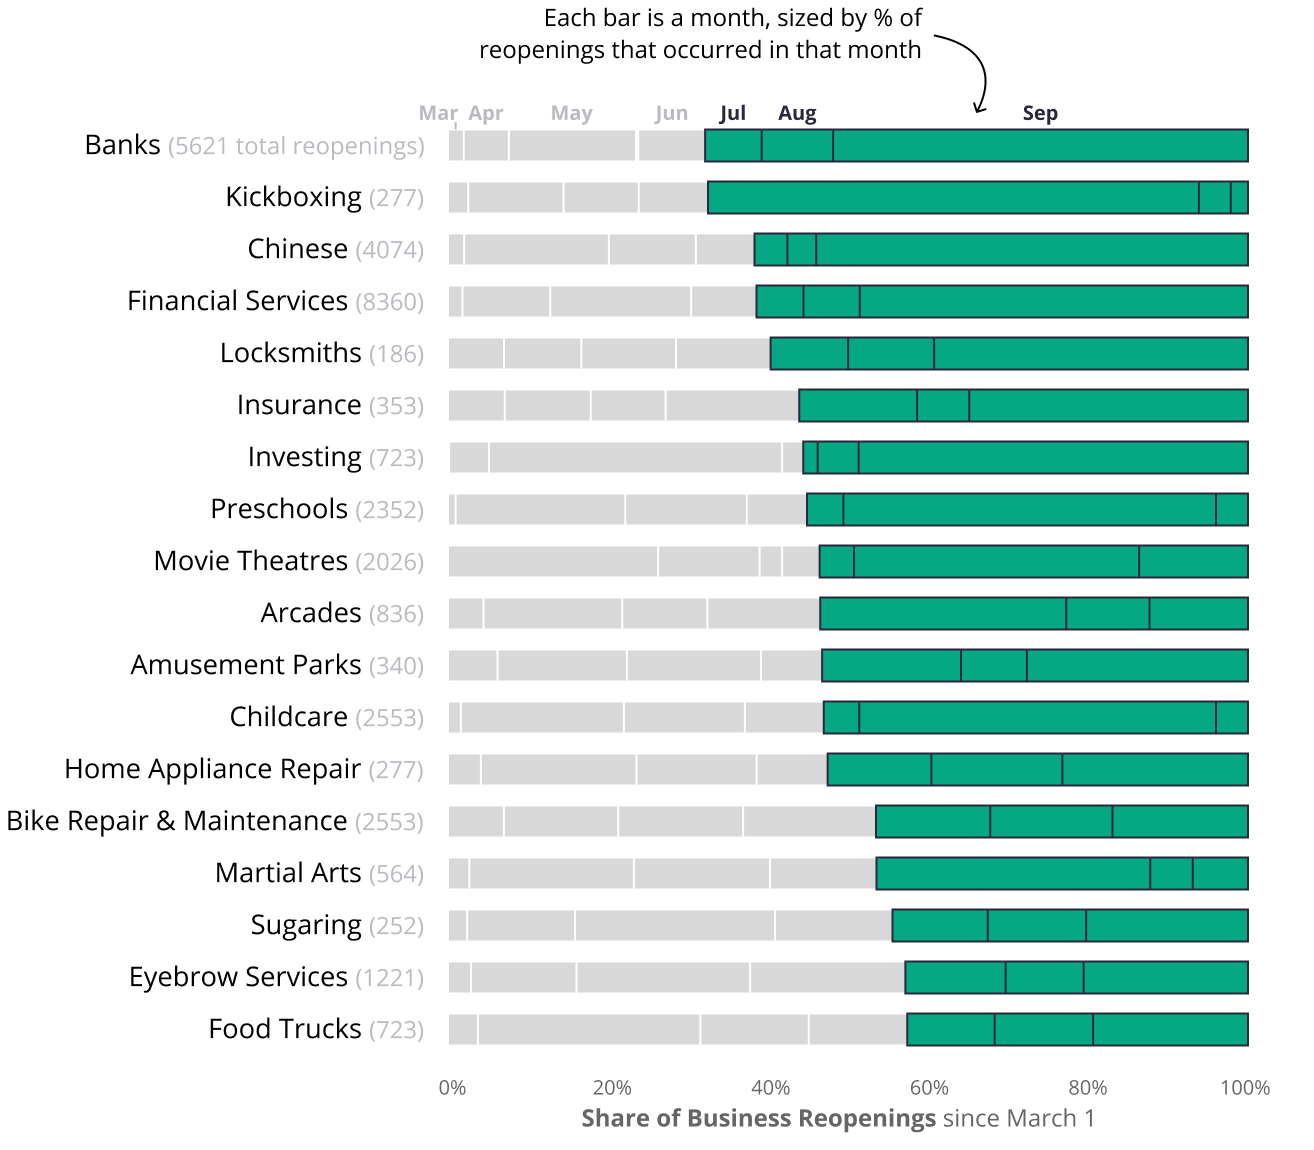
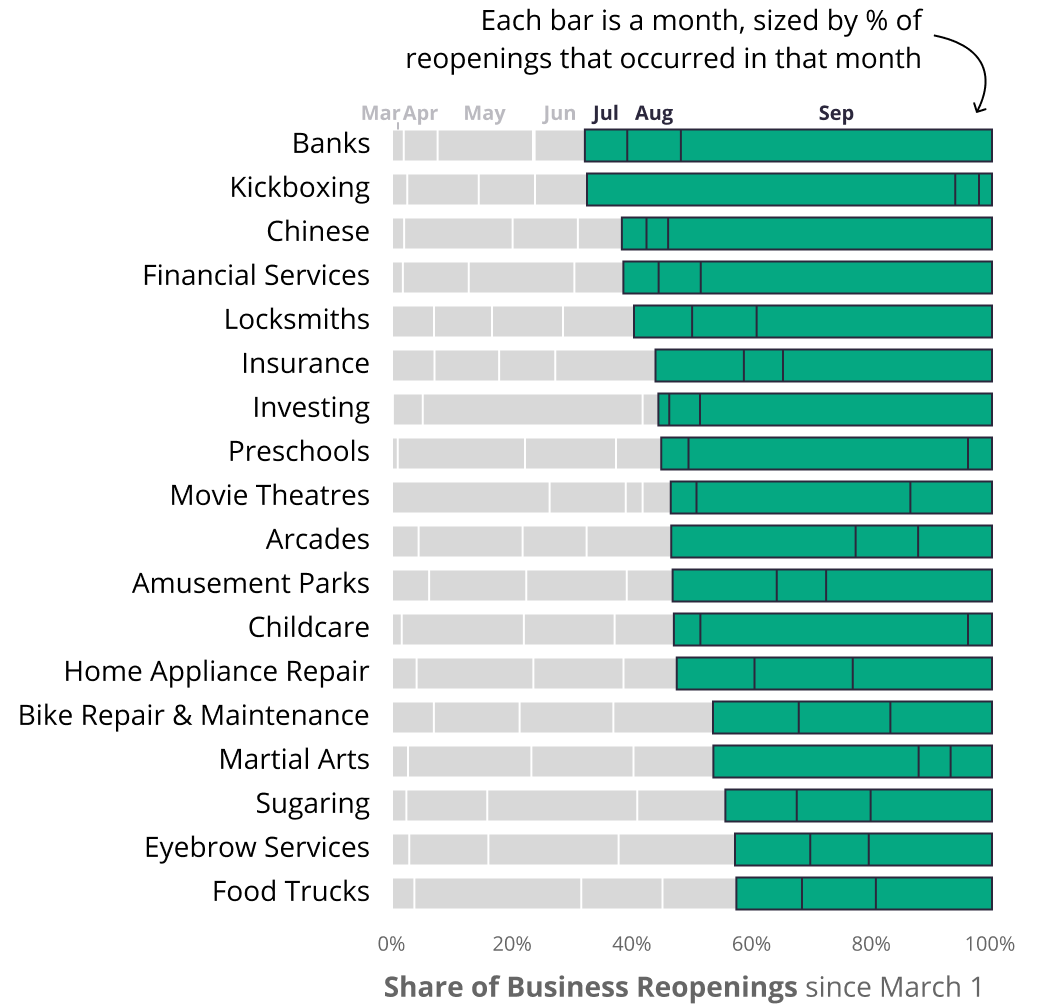
With school back in session, Yelp’s data indicates that preschools, childcare and kids activities experienced high proportions of their reopenings in Q3 relative to their total category openings since March 1, with 55%, 53% and 48%, respectively. People are returning to exercise classes with kickboxing and martial arts experiencing 68% and 46% of their reopenings in Q3. Beauty salons are also making a comeback with 44% of reopenings for sugaring businesses and 43% of reopenings for eyebrow services happening in Q3. Similarly, leisure activities began to reopen at higher rates, including movie theaters, arcades and amusement parks, all with 54% to 53% of their reopenings in the third quarter.
A handful of home and local services businesses experienced a large percentage of their openings in Q3, including locksmiths, home appliance repair and bike maintenance with 60%, 53%, and 47% of total category reopenings in the quarter, respectively. As consumers navigate the effects of the pandemic on their personal finances, many financial service providers experienced a majority of their reopenings in Q3. Banks, financial advisors, tax services, insurance companies and investing firms led the way with 68%, 66%, 58%, 56% and 56%, respectively, of their category reopenings in Q3.
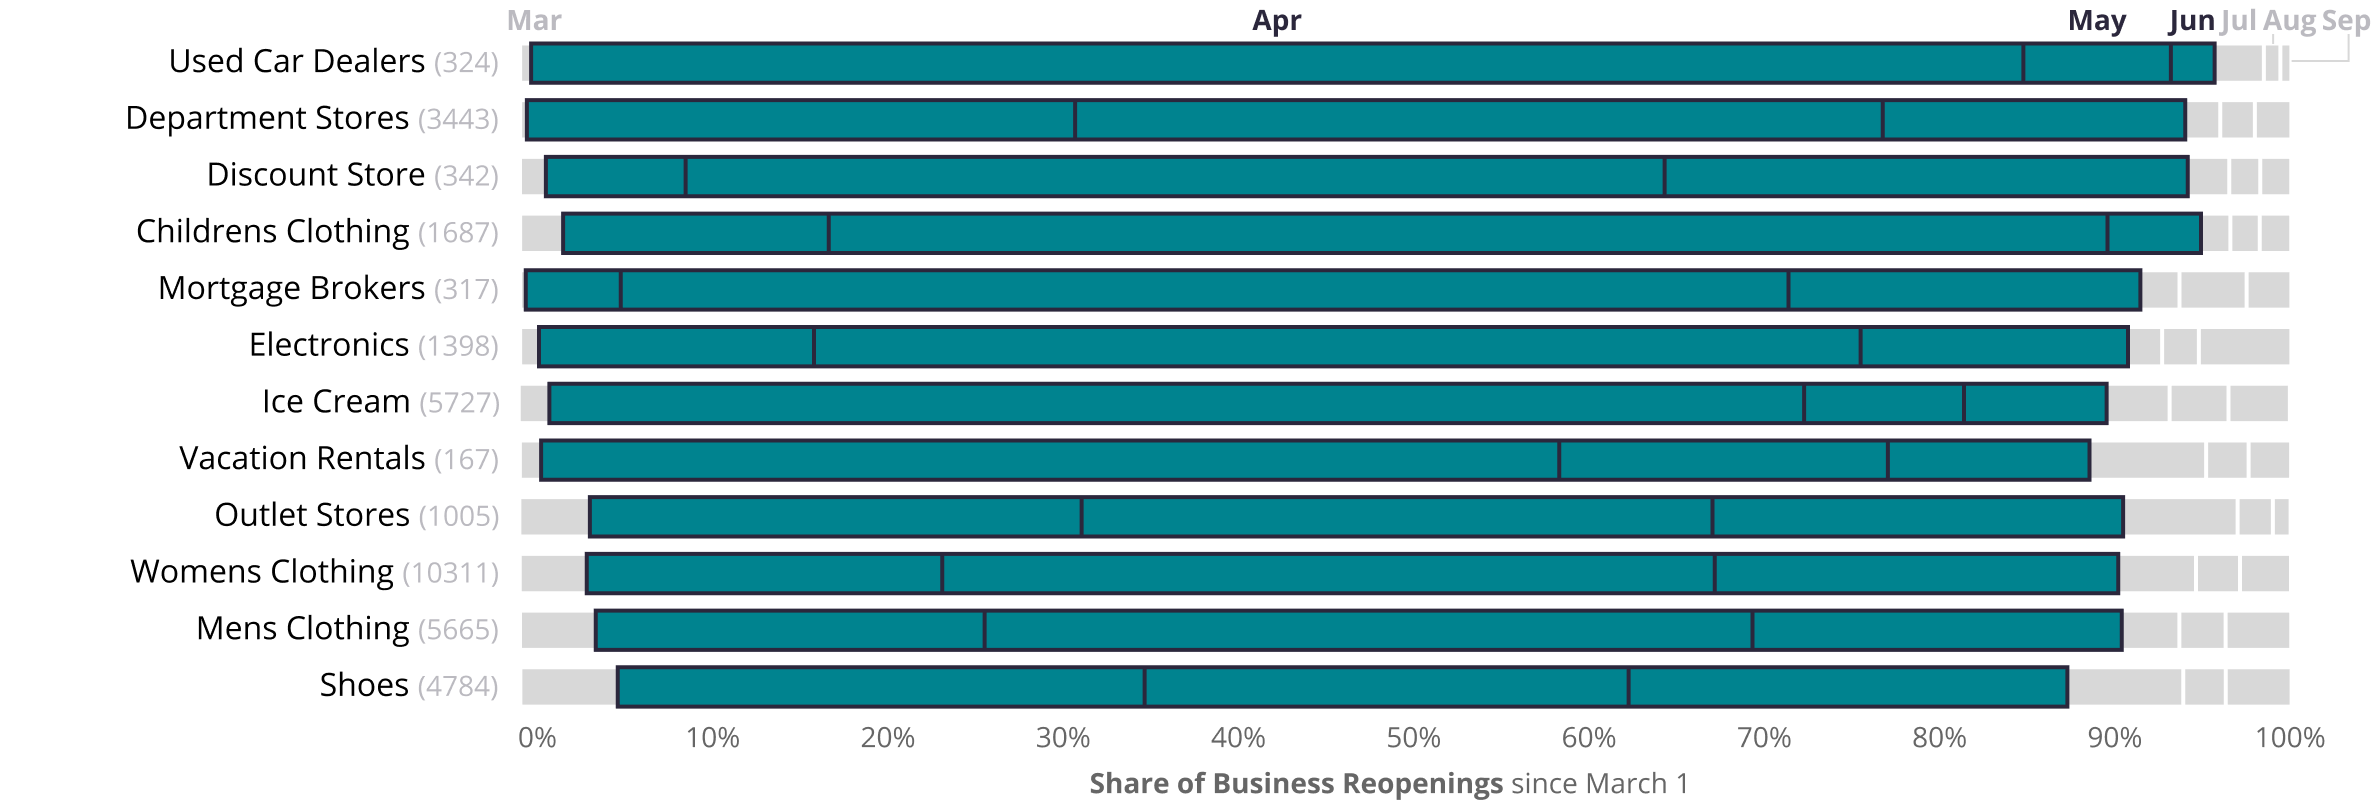
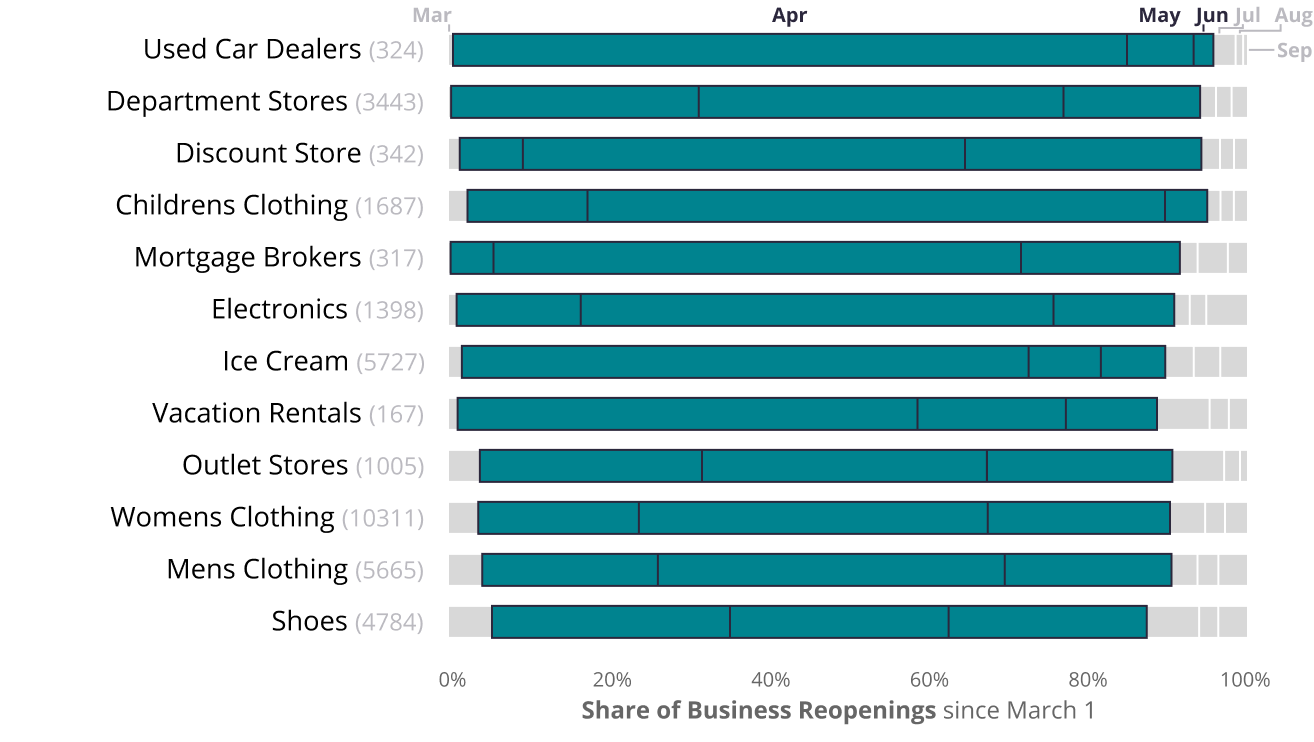
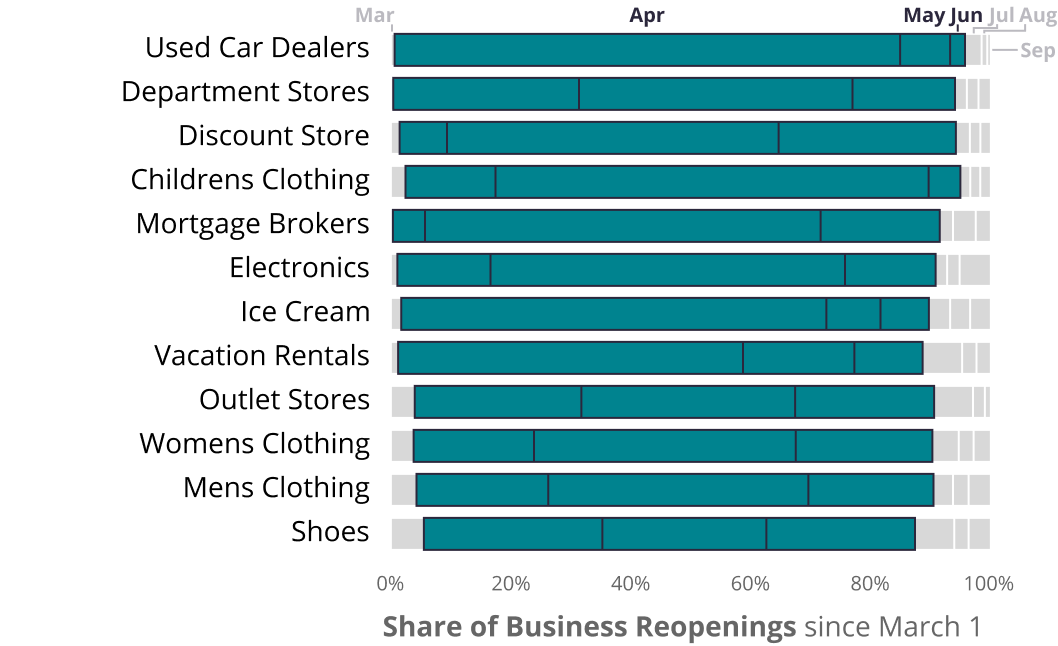
Comparatively, Yelp data indicates that retail businesses experienced especially high percentages of reopenings in Q2, led by department stores, child clothing, outlet stores, women and men’s clothing stores and shoes: 94%, 92%, 87%, 86% and 82% of their categories openings occurred in Q2, respectively.
Consumers are Returning to their Pre-Pandemic Activities
Share of all business reopenings since March 1, 2020 by month
Categories on Yelp that experienced a high percentage of reopenings* in Q3 2020
Categories on Yelp that experienced a high percentage of reopenings* in Q2 2020
Health and safety precautions have proven to be critical in this reopening phase. During Q3, Yelp noted a rise in review mentions of words associated with safely operating a business during the pandemic. These words included mentions of temperature checks (up 144% from Q2), sanitizer (up 45%), masks (up 24%), and outdoor seating (up 74%).
Consumer Interest is Up for Outdoor-based Professional, Local, Auto and Home Services
Throughout the summer, Yelp data continues to show an increase in customer interest in all things outdoors, including outdoor services businesses. In Q3 2020, share of consumer interest surged for businesses that repair and service bicycles (104% increase from a year earlier), boats (75% increase), and RVs (32% increase), while consumers’ general interest in RV parks (59% increase) ramped up throughout the summer – as consumers leveraged these modes of transport for both leisure and socially distanced travel.
As the months heated up, consumers looked towards their backyards for entertainment and relaxation – and the amount of work necessary to make outdoor spaces usable. Share of interest in home services for pool and hot tub services, and for landscape architecture, increased by 41% and 35%, respectively, as consumers spent more time at home rather than traveling.
We also see the impact of people eager to vacation, even if it’s close to home, in the increase in consumer interest for outdoor activities. Among the top-gaining categories, many were outdoors-focused, such as farms and jet-ski rentals. The natural ability to enjoy these activities while safely social distancing was a major appeal this summer.
Consumers are Craving Outdoor Experiences
Categories with the largest percent increase in consumer interest*, Q3 2020 vs. Q3 2019
Outdoor Dining Spikes as Consumers are Eager to Head Back to Restaurants
With indoor dining options still limited across the nation, both new and existing restaurants have been quickly adapting, many focusing on takeout, delivery and outdoor seating to keep their doors open – and consumers have been flocking to these options throughout the pandemic.
Throughout Q2, earlier in the pandemic, Yelp observed an increase in review mentions for words related to eating out while sheltering in place or quarantining such as: contactless (up 7,839% YoY), curbside (up 6,405% YoY), takeout (up 475% YoY), pickup (up 261% YoY), and delivery (up 164% YoY).
In Q3, we saw review mentions decrease from Q2 for takeout, delivery and pickup, as these early forms of adapting to the pandemic transitioned to safely eating outdoors while social distancing. The frequency of these terms in reviews is still well above the pre-pandemic baseline.
Outdoor dining was one of the biggest trends of the summer as diners looked for ways to eat out while staying safe. In Q3 2020, the share of U.S. restaurant reviews mentioning ‘outdoor dining’ was more than double the share in Q3 2019. And the share of U.S. restaurant searches using the ‘outdoor seating’ filter on Yelp was up more than 5X compared to the same time last year. Similarly, review mentions for ‘street dining’ increased 5X between Q3 and Q2 2020. To meet this unprecedented consumer demand, restaurant and food-related businesses moved their existing operations to sidewalks and streets, and launched new ventures catering to the demand.
— Jessica Mouras, Carl Bialik and Daniel Gole contributed to this report
If you'd like additional detail on how the economy is shifting, please contact us at press@yelp.com or join our mailing list to receive an email when new reports are released.
Interested in learning how Yelp data can assist you in developing market insights for your business? Yelp Knowledge can help, learn more here.
Methodology
Business Openings
Openings are determined by counting new businesses listed on Yelp, which are added by either business owners or Yelp users. New openings in this report are specifically for restaurant and food categories. Openings are adjusted year-over-year, meaning openings in 2020 are relative to the same period of time in 2019 for the same category and geographic location. This adjustment corrects for both seasonality and the baseline level of Yelp coverage in any given category and geography.
Business Reopenings
On each date, starting with March 1, we count U.S. businesses that were temporarily closed and reopened through September 30. A reopening is of a temporary closure, whether by using Yelp’s temporary closure feature or by editing hours, excluding closures due to holidays. Each reopened business is counted at most once, on the date of its most recent reopening.
Openings and reopenings are based on when they're indicated on Yelp, as such, the data may lag slightly from the true opening or reopening date due to a delay in reporting from consumers and business owners.
Resilience
Community resilience compares the rate of business openings per state from Q2 to Q3 in 2020 and adjusts for the natural rate of openings in 2019 to determine how well states have rallied to foster new businesses during the pandemic.
Mathematically, resilience is calculated as Q3 YoY adjusted openings less Q2 YoY adjusted openings divided by Q2 YoY adjusted openings. YoY adjusted openings are openings this year divided by openings last year (for any given month/quarter etc.).
Consumer Interest By Business Category
We measure consumer interest, in terms of U.S. counts of a few of the many actions people take to connect with businesses on Yelp: viewing business pages or posting photos or reviews. Consumer interest for each category is based on the Q3 year-over-year change in the category’s share of all consumer actions in its root category.
Review Mentions and Search Filters
For the data regarding outdoor dining, we measured the share of total words in U.S. restaurant reviews containing phrases related to outdoor dining. Similarly, for search filters we measure the share of U.S. restaurant searches using filters for takeout, delivery, or outdoor seating.
Downloadable static graphics can be found here.
See Yelp's previous Coronavirus Economic Impact Reports at our Data Science Medium, Locally Optimal.