Q2 2021
Changes in Consumer Interest On Yelp Correlate to Vaccinations, According to the Yelp Economic Average
For the Q2 2021 Yelp Economic Average report, we’re using a new methodology that tracks several indicators on a daily basis. For more on the methodology for this report, click here.
In Q2 2021 the U.S. saw a significant decrease in new COVID-19 cases and hospitalizations fueled by many Americans getting vaccinated once they qualified. While the Delta variant continues to create some uncertainty, 59% of Americans 18 years of age and older are fully vaccinated, every state except Hawaii has fully reopened, and across the U.S. businesses are resuming normal operations as people begin to return to pre-pandemic activities.
Yelp’s latest Economic Recovery Report, published in June, showed an increase in consumers getting back to pre-pandemic activities – such as dining out, in-person shopping and returning to their offices. In this report, we take a deeper look at the impact of vaccines on local economic recovery across the U.S. in the second quarter of 2021, uncovering a correlation between consumer interest on Yelp and vaccinated populations. The report also reveals business reopenings reaching the highest volume in the last year, as well as significant new business opening trends, as many industries see new openings reach above pre-pandemic levels.
Increased COVID-19 Vaccinations in April Correlate to an Increase in Consumer Activity in May and June Across States and Counties
In April, the CDC declared travel safe for vaccinated Americans and in the same month the U.S. reached a peak vaccination rate of 3.4 million shots administered daily as the vaccine became more widely available. Each state took a localized approach to reopening – many states like New York announced easing of restrictions in April; others, like Georgia, lifted all COVID-19 restrictions at once. Many counties tailored those plans further, prioritizing lifting restrictions that would aid businesses growth, driven by decreases in COVID-19 cases and hospitalizations, and increases in their population of vaccinated people.
Leveraging COVID-19 vaccination data for fully vaccinated people provided by the CDC for counties and states, Yelp data shows that the increase in vaccinated people in a specific geographic location in April correlates to a significant increase in consumer interest on Yelp in that area to follow in May and June. Consumer interest – measured by counting a few of the many actions people take to connect with businesses on Yelp: viewing business pages or posting photos or reviews – demonstrates how people are engaging with local businesses, in turn providing insight into the local economic recovery.
Q2 Business Reopenings Reach Highest Level in a Year as Americans Ease Back Into In-Person Activities
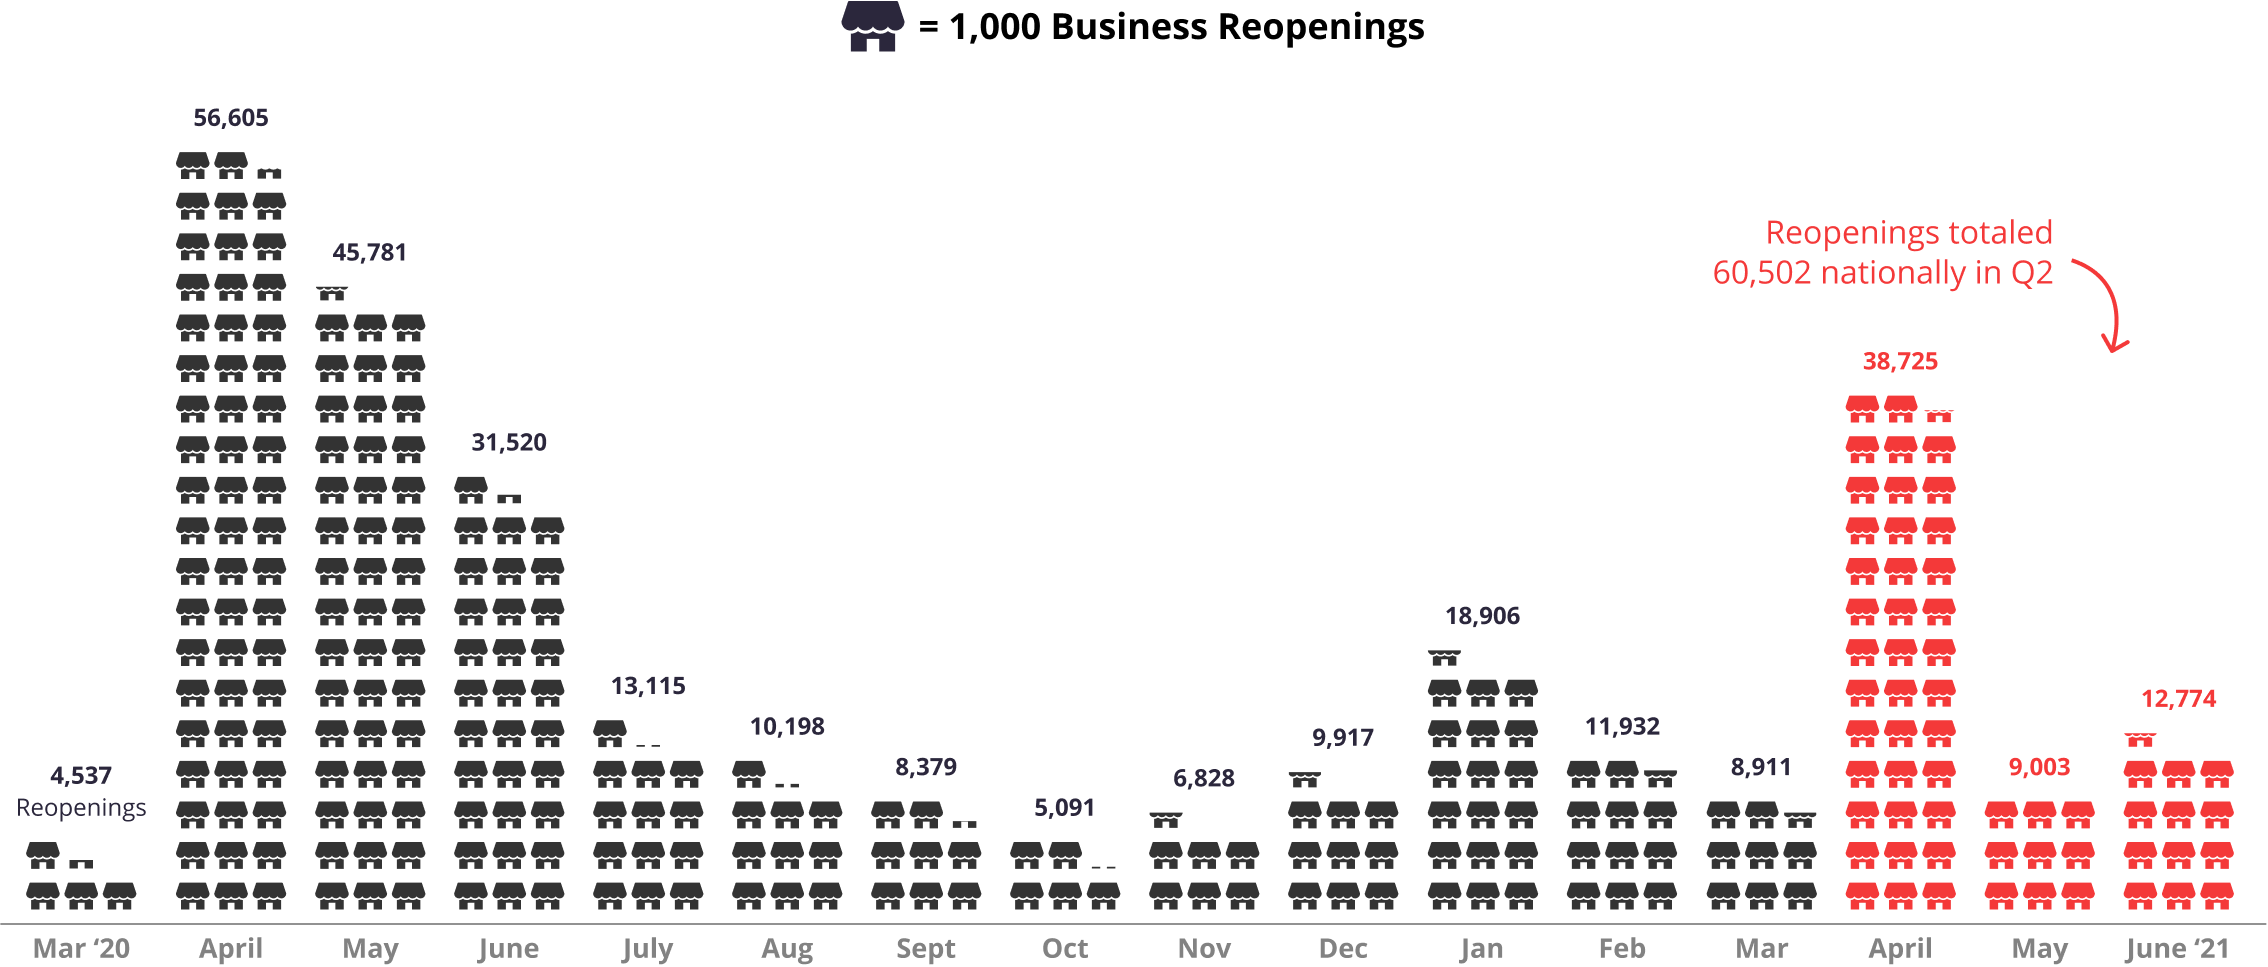
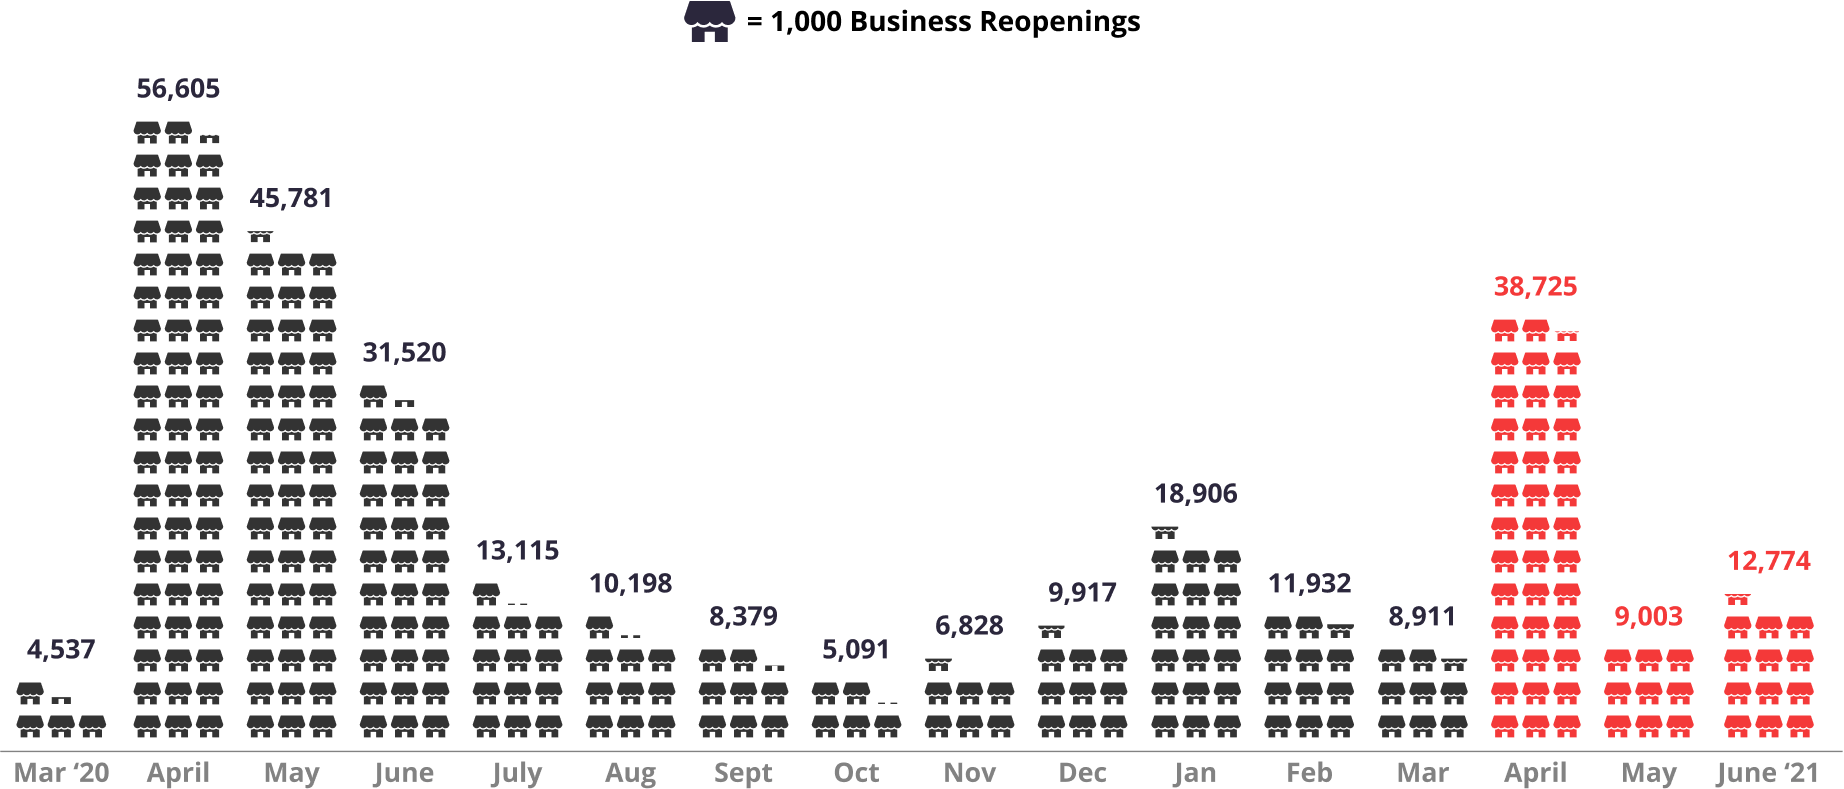
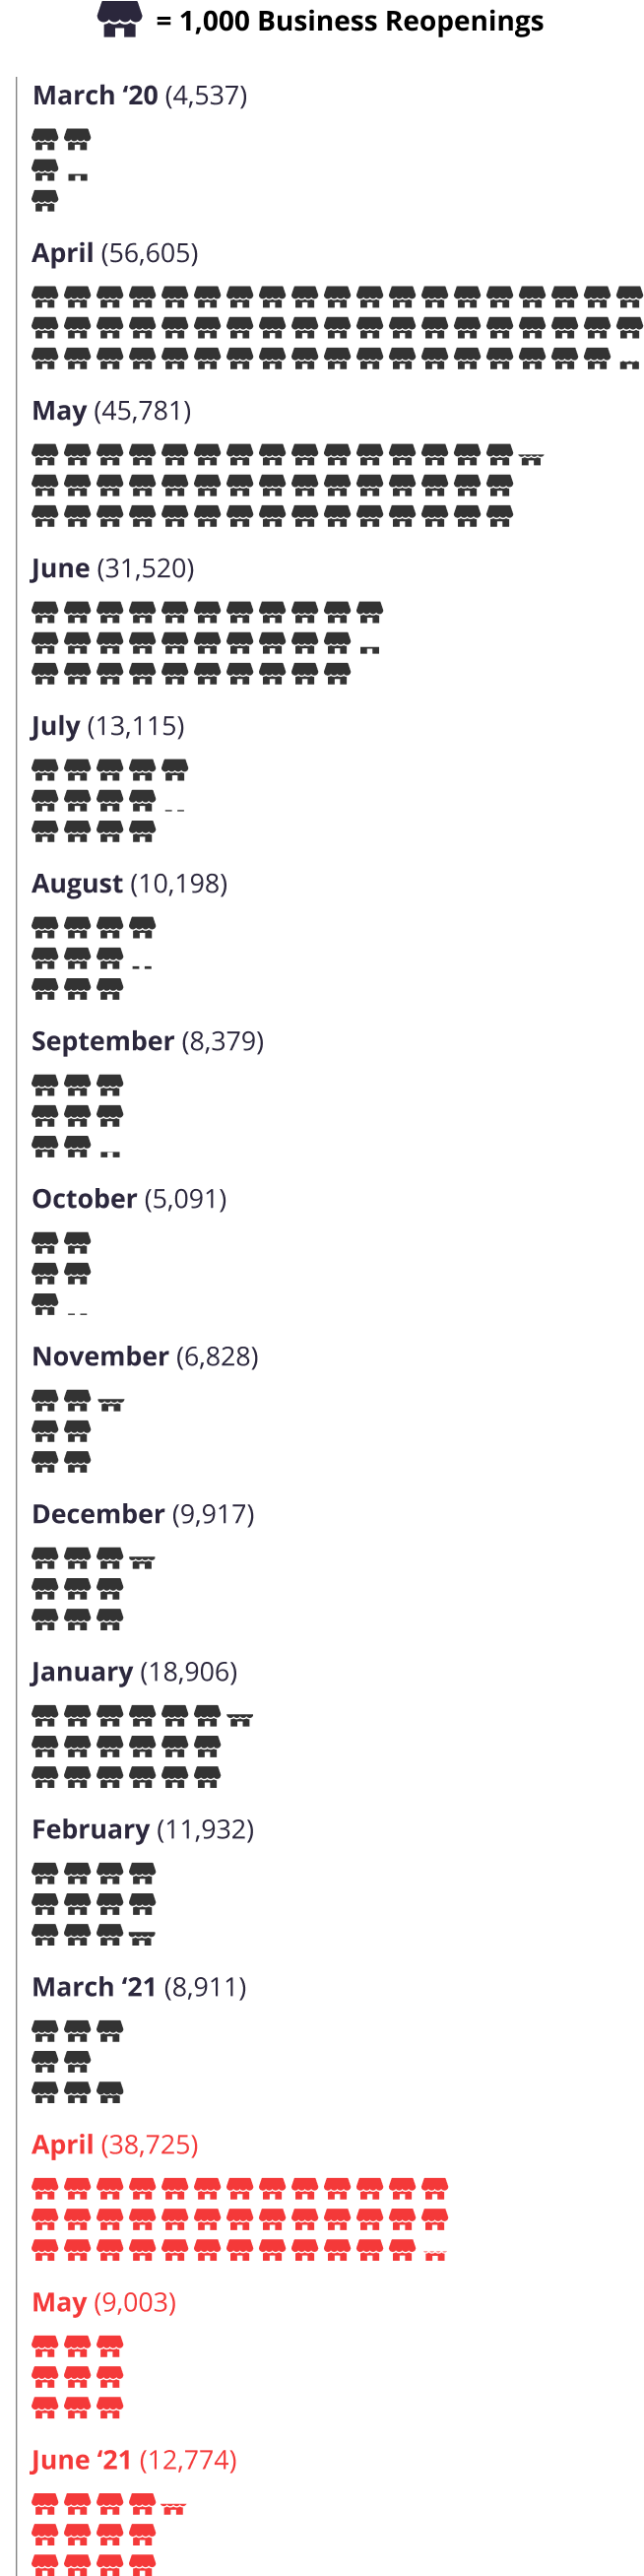
In Q2 2021, 60,502 businesses reopened, marking the highest volume of reopenings in the last year. In April alone there were 38,725 reopenings, the largest monthly volume of reopenings since May 2020.
Business Reopenings Spike Again in Q2
National business reopenings by month, March 2020 – June 2021
Restaurant and food businesses, as well as retail businesses, experienced the highest number of businesses that reopened in Q2 with 22,441 and 13,700 reopenings, respectively. While business reopenings were strong across categories, the return to activities that were upended by social distancing guidelines — such as gyms (592 reopenings), waxing salons (644), hair salons (1,214), brunch restaurants (1,385), massage therapy (531), and cosmetic and beauty supply stores (275) — all saw substantial increases.
New Businesses Open Above Pre-Pandemic Levels in Professional, Home and Local, and Automotive Services, While Restaurants and Other Categories Inch Closer to a Full Recovery
Applications for new businesses in the U.S. from June 2020 through May 2021 increased at the greatest pace on record since 2004, as more people looked for increased flexibility in the way they work or turned their “side hustles” into full-time jobs. This was evident in Q2 2021, with 150,940 new business openings on Yelp, surpassing pre-pandemic levels by 8% (compared to Q2 2019) and up from 146,160 in Q1 2021.
New Businesses Open Above Pre-Pandemic Levels in Q2
Business openings by month on Yelp, July 2017 – June 2021
New business openings across categories are largely driven by changes in consumer behavior related to the pandemic like home improvement, a return to in-person dining and rising demand for cars. Home services accounted for 51,445 of new businesses opened in Q2 2021, a 48% increase compared to pre-pandemic levels (Q2 2019). Our data reveals an increase in new business openings across lawn services (3,165 openings, up 189%), home cleaning (6,558, up 139%), drywall installation and repair (1,253, up 119%), and painters (3,787, up 96%).
Local services saw 16,047 new businesses open in Q2 2021, a 30% increase compared to pre-pandemic levels (Q2 2019) with nannies (86, up 91%), septic services (208, up 43%), carpet cleaning (1,282, up 62%), junk removal and hauling services (2,328, up 162%), and junkyards (38, up 111%) driving the increase.
Professional services had 13,907 new businesses open in Q2 2021, a 21% increase compared to pre-pandemic levels (Q2 2019). As offices in many states reopen, billing services (67, up 52%) office cleaning (4,256, up 120%), business consulting (1,204, up 26%), security services (271, up 25%), and personal assistants (129, up 57%) are among the new businesses opening above pre-pandemic levels.
With more Americans opting out of taking mass transit, demand for automotive-related services continues to grow. In Q2 2021, 9,708 new automotive businesses opened, a 13% increase compared to pre-pandemic levels (Q2 2019). Auto repair (1,915, up 9%), car window tinting (297, up 49%), car rental (178, up 51%), and car buyers (156, up 42%) all experienced increases above pre-pandemic levels.
Restaurants and food businesses accounted for 19,698 new businesses opened in Q2 2021,12% below Q2 2019, which had the highest new business openings in the last five years. Even as restaurants reopen, food delivery services (670, up 166%) remain well above pre-pandemic levels. Food trucks (1,767, up 25%), seafood markets (81, up 44%), soul food (176, up 30%), desserts (1,628, up 47%), and food courts (59, up 40%) have all trended above pre-pandemic levels.
New Business Openings Remain Strong in Q2 Across Categories
Business openings by month on Yelp, July 2017 – June 2021
2017-2018
2018-2019
2019-2020
2020–2021
Southern States See the Largest Share of the New Business Boom
The Southern U.S. accounted for nine of the 10 states with the largest increase in new business openings compared to pre-pandemic levels, including Mississippi (1,040 openings, up 52% from Q2 2019), Alabama (2,035, up 39%), Georgia (6,455, up 37%) Kentucky (1,698, up 37%) and Louisiana (2,000, up 35%).
More than 65% of all states saw an increased volume of new business openings compared to pre-pandemic Q2 2019 levels. States that experienced a 5% or more decrease in business openings in Q2 2021 compared to Q2 2019 include: New Hampshire (6% decrease), Maine (7% decrease), New York (9% decrease), California (9% decrease), South Dakota (10% decrease), New Mexico (12% decrease), Washington (13% decrease), and Oregon (13% decrease).
New Business Openings in Southern States Are Exceeding Pre-Pandemic Levels
Change in New Business Openings, Q2 2021 vs. Q2 2019
Overall Yelp data reflects positive momentum in the economic recovery as new businesses open and many established businesses reopen. While vaccination rates fluctuate amidst state’s reopenings, unvaccinated populations remain vulnerable to new variants and outbreaks, which may require stricter measures to suppress cases. We’ll continue to report on how local economies are recovering in our next Economic Recovery Report.
— Jessica Mouras and Carl Bialik contributed to this report.
If you'd like additional detail on how the economy is shifting, please contact us at press@yelp.com or join our mailing list to receive an email when new reports are released.
Interested in learning how Yelp data can assist you in developing market insights for your business? Yelp Knowledge can help, learn more here.
Methodology
Consumer Interest Correlations with COVID-19 Vaccinations
COVID-19 Vaccinations: The vaccination period is the percentage point increase in vaccinations in the specific geographic location measured between April 1 and April 30, corresponding to the time where most locations began to open vaccine distribution to the general public. For example, an increase from 20% of a location’s total population being vaccinated at the end of March to 38% of the population being vaccinated at the end of April would be an increase of 18 percentage points. We used COVID-19 vaccination data provided by the CDC for counties and states. Note: the CDC did not have April vaccination data available for some counties in Hawaii, California, and Texas. Those counties were excluded from the analysis.
Consumer Interest: We measure consumer interest, in terms of U.S. counts of a few of the many actions people take to connect with businesses on Yelp: viewing business pages or posting photos or reviews — split by state and county.
Increasing consumer interest in these geographic locations in May and June – relative to the April change in percentage of vaccinated people – is a good general indicator of consumer behavior reverting to the norm and a state or county being more active economically and socially. Of note, correlation and causation are not equivalent, and we are not claiming that COVID-19 vaccinations are single-handedly driving consumer interest. Yelp observes a statistically significant correlation between a state’s or county’s change in percentage of vaccinated people in April and consumer interest action share changes in May and June. The relationship holds out after controlling for other variables, including case counts, mask usage, and political lean, according to regressions we ran at the state and county levels.
New Business Openings
Openings are determined by counting new businesses listed on Yelp, which are added by either business owners or Yelp users. Openings are adjusted year over two-years (2021 vs 2019), meaning openings are relative to the same period of time in the period two years prior for the same category and geographic location. This adjustment corrects for both seasonality and the baseline level of Yelp coverage in any given category and geography
Business Reopenings
On each date, starting with March 1, 2020, we count U.S. businesses that were temporarily closed and reopened through June 30, 2021. A reopening is of a temporary closure, whether by using Yelp’s temporary closure feature or by editing hours, excluding closures due to holidays. Each reopened business is counted at most once, on the date of its most recent reopening.
Openings and reopenings are based on when they're indicated on Yelp, as such, the data may lag slightly from the true opening or reopening date due to a delay in reporting from consumers and business owners.
Downloadable static graphics can be found here.
See Yelp's previous Coronavirus Economic Impact Reports at our Data Science Medium, Locally Optimal.