
Yelp data finds business growth in non-downtowns surpasses business growth in office-centric downtowns of cities across the U.S.
October 4, 2022
For more on the methodology for this report, click here.
The pandemic resulted in significant changes to how Americans work and where they live, with many companies transitioning to remote work. As companies begin to permanently commit to a hybrid work model or, like Yelp, a fully remote workplace, the landscape of office-centric downtowns has changed for the foreseeable future. To better understand how the shift to remote work has impacted the recovery of local businesses in cities across the U.S., Yelp looked into how the average yearly business growth in downtown and non-downtown areas has changed, as well as how the number of existing businesses has changed across six major cities in the U.S.
Overall, Yelp data shows the average yearly business growth during the pandemic is accelerating faster in non-downtown neighborhoods compared to downtown areas, and business growth in 2022 is greater in non-downtown areas compared to the pre-pandemic average. Additionally, some business categories – such as food businesses and restaurants – are seeing more growth in non-downtown neighborhoods than other types of businesses.
The average yearly business growth in non-downtown areas is nearly triple that of downtowns
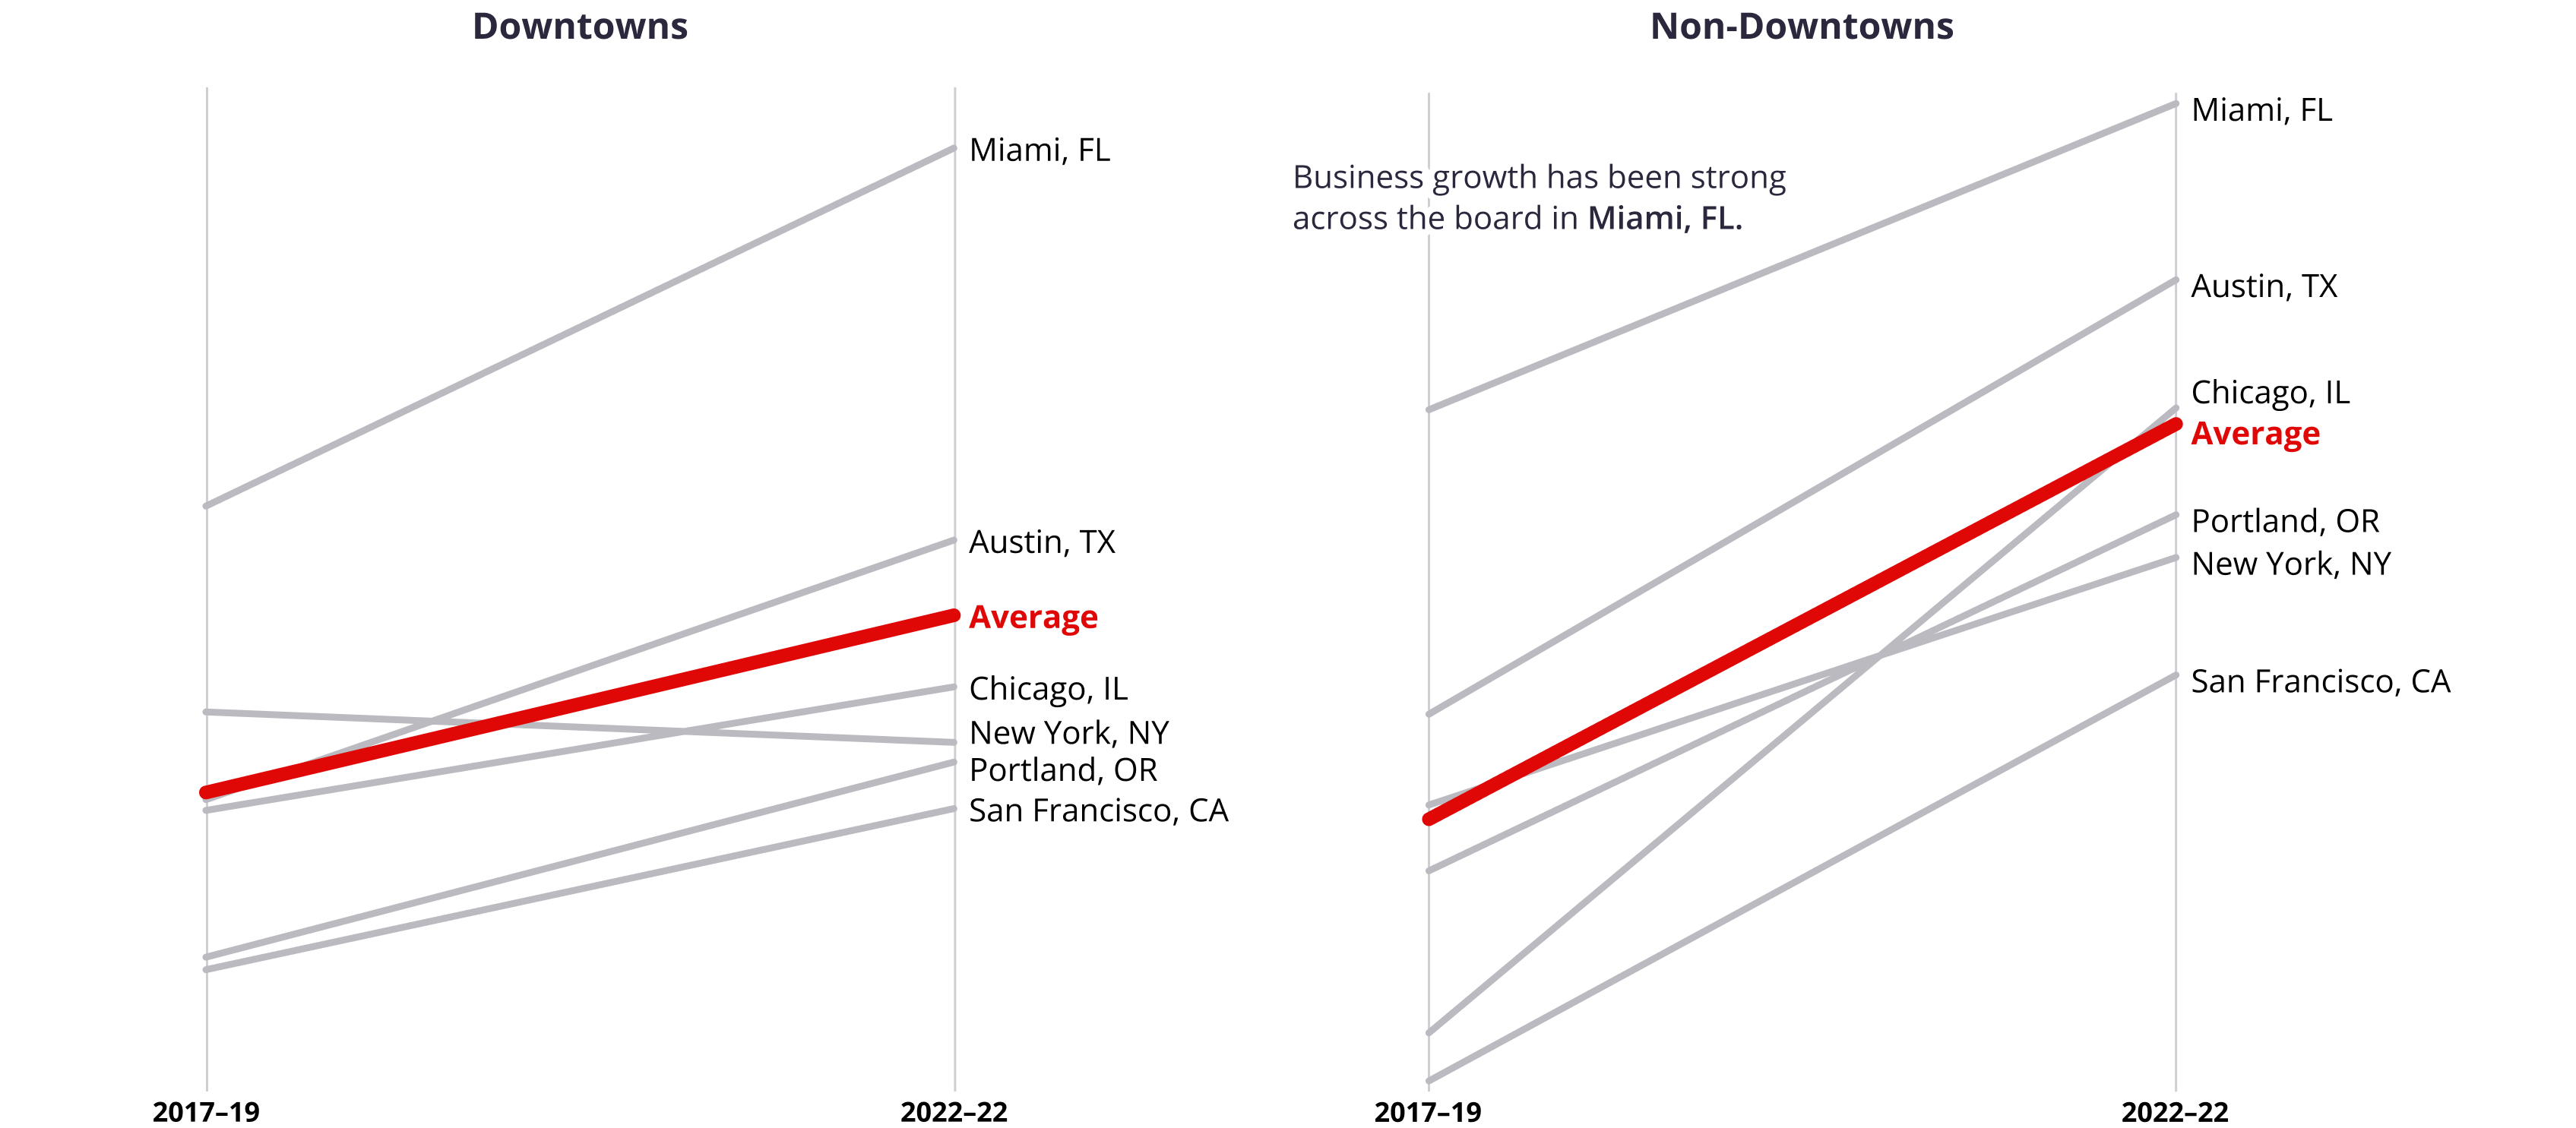
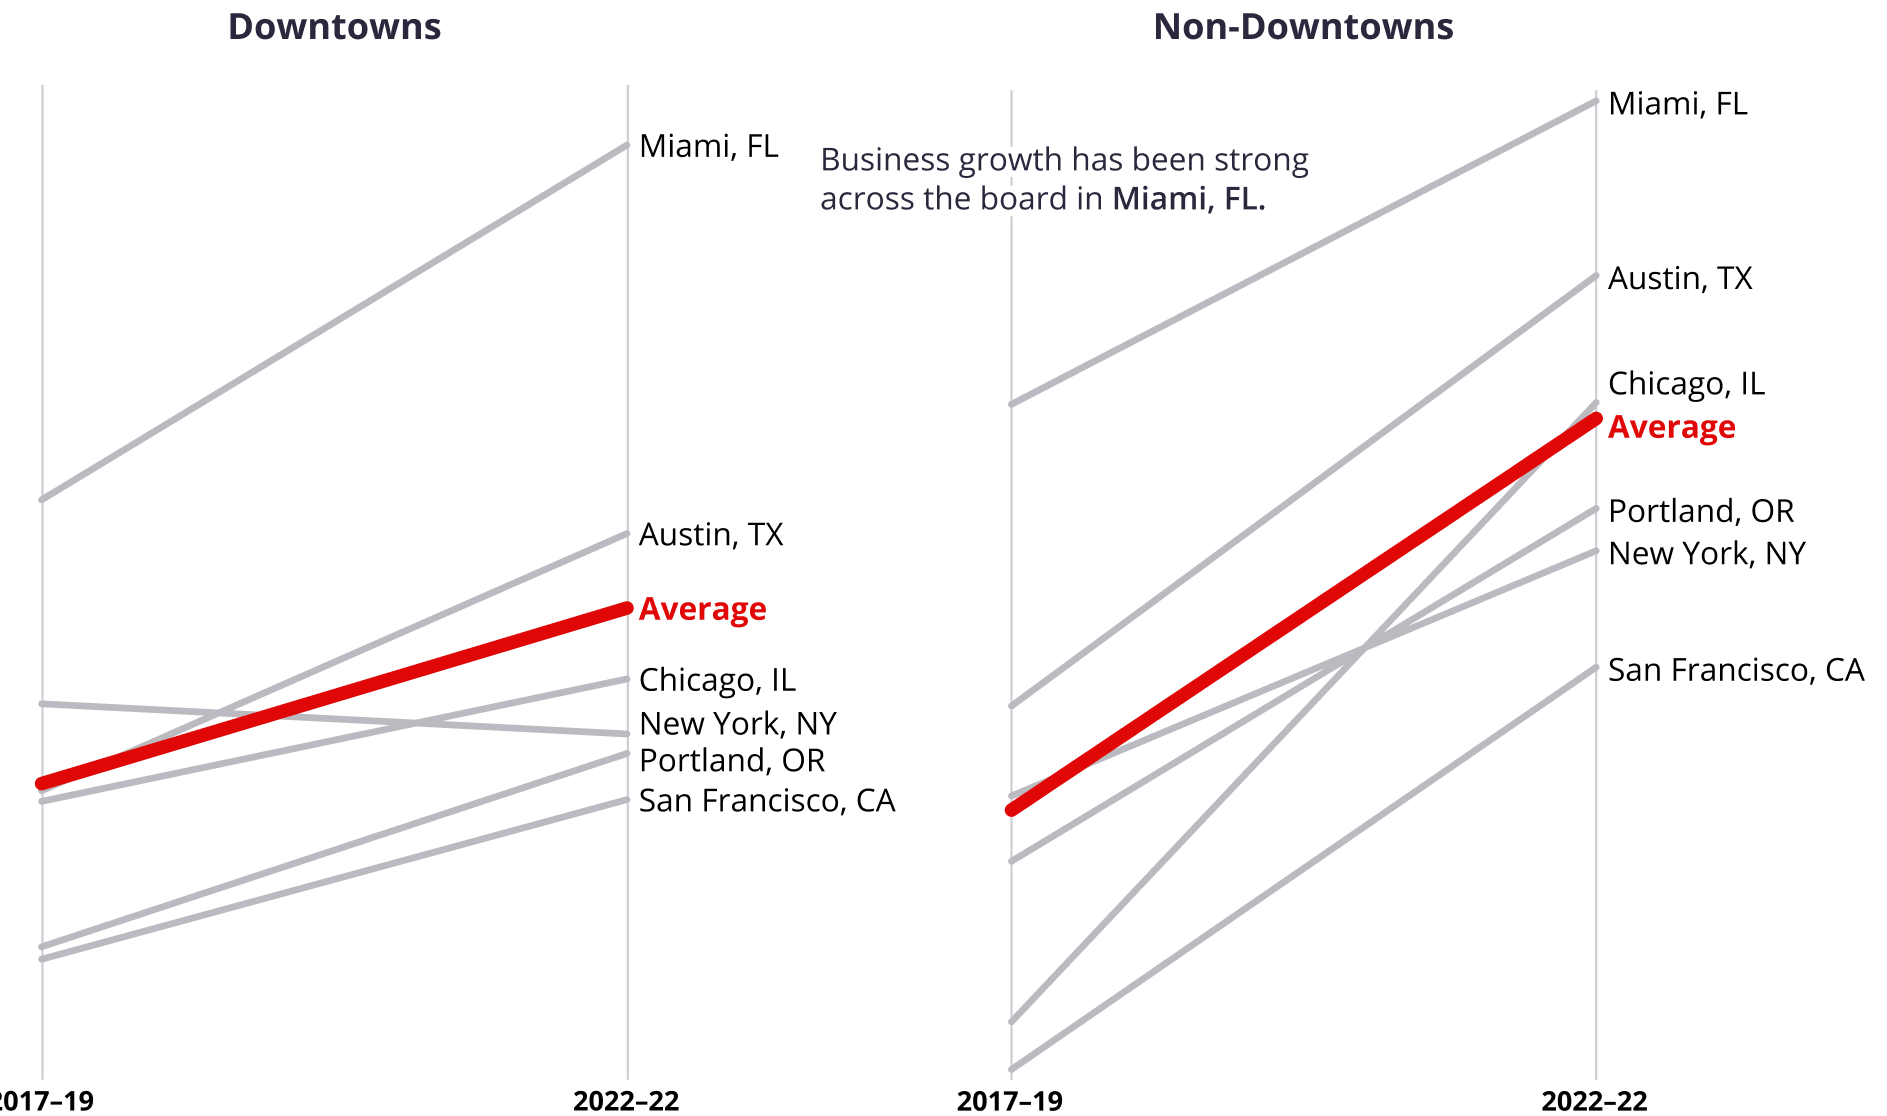
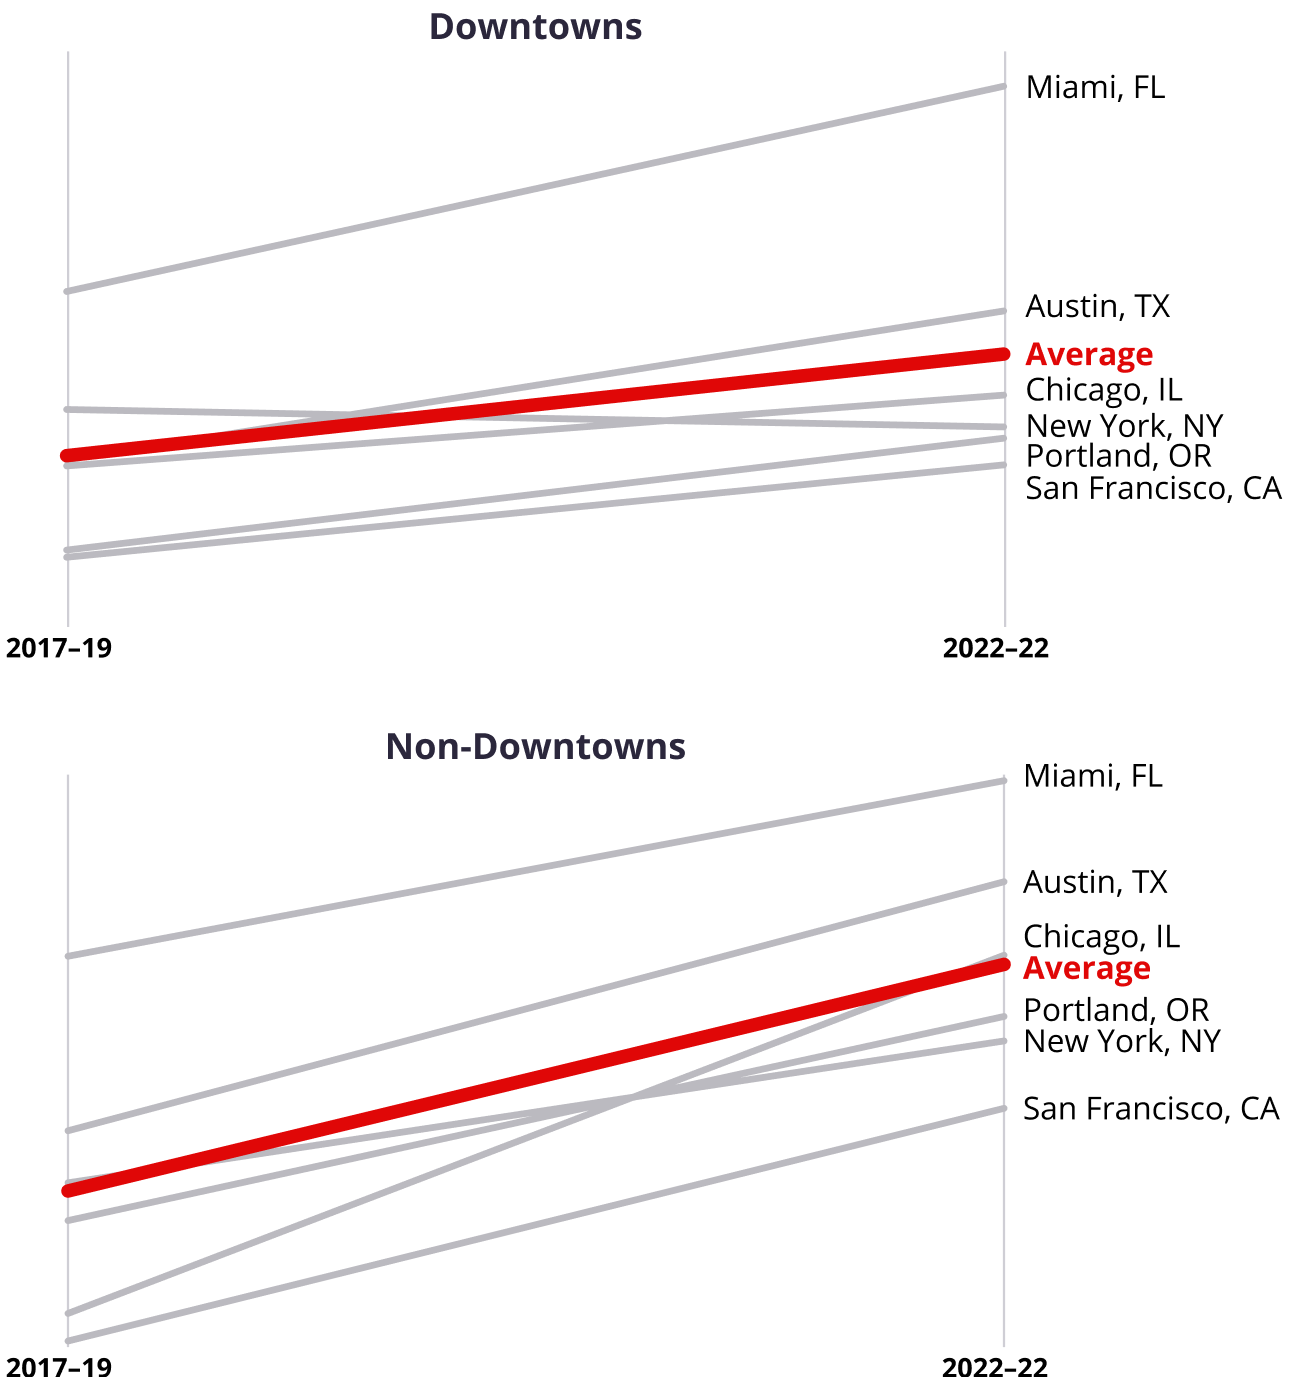
Yelp data shows that while prior to the pandemic (April 2017 - 2019) the average yearly business growth was very similar between downtowns and non-downtown areas of major metropolitan cities, non-downtowns have grown faster during the pandemic (April 2020 - 2022) than downtowns. Non-downtown business growth accelerated by 313%, on average, while downtown business growth accelerated by 116%, on average.
Average Business Growth Has Increased Across All Non-Downtowns Since the Pandemic
Average yearly business growth on Yelp in select cities, 2017–2019 vs. 2020–2022
Business growth in non-downtown neighborhoods outpaced downtowns in 2022
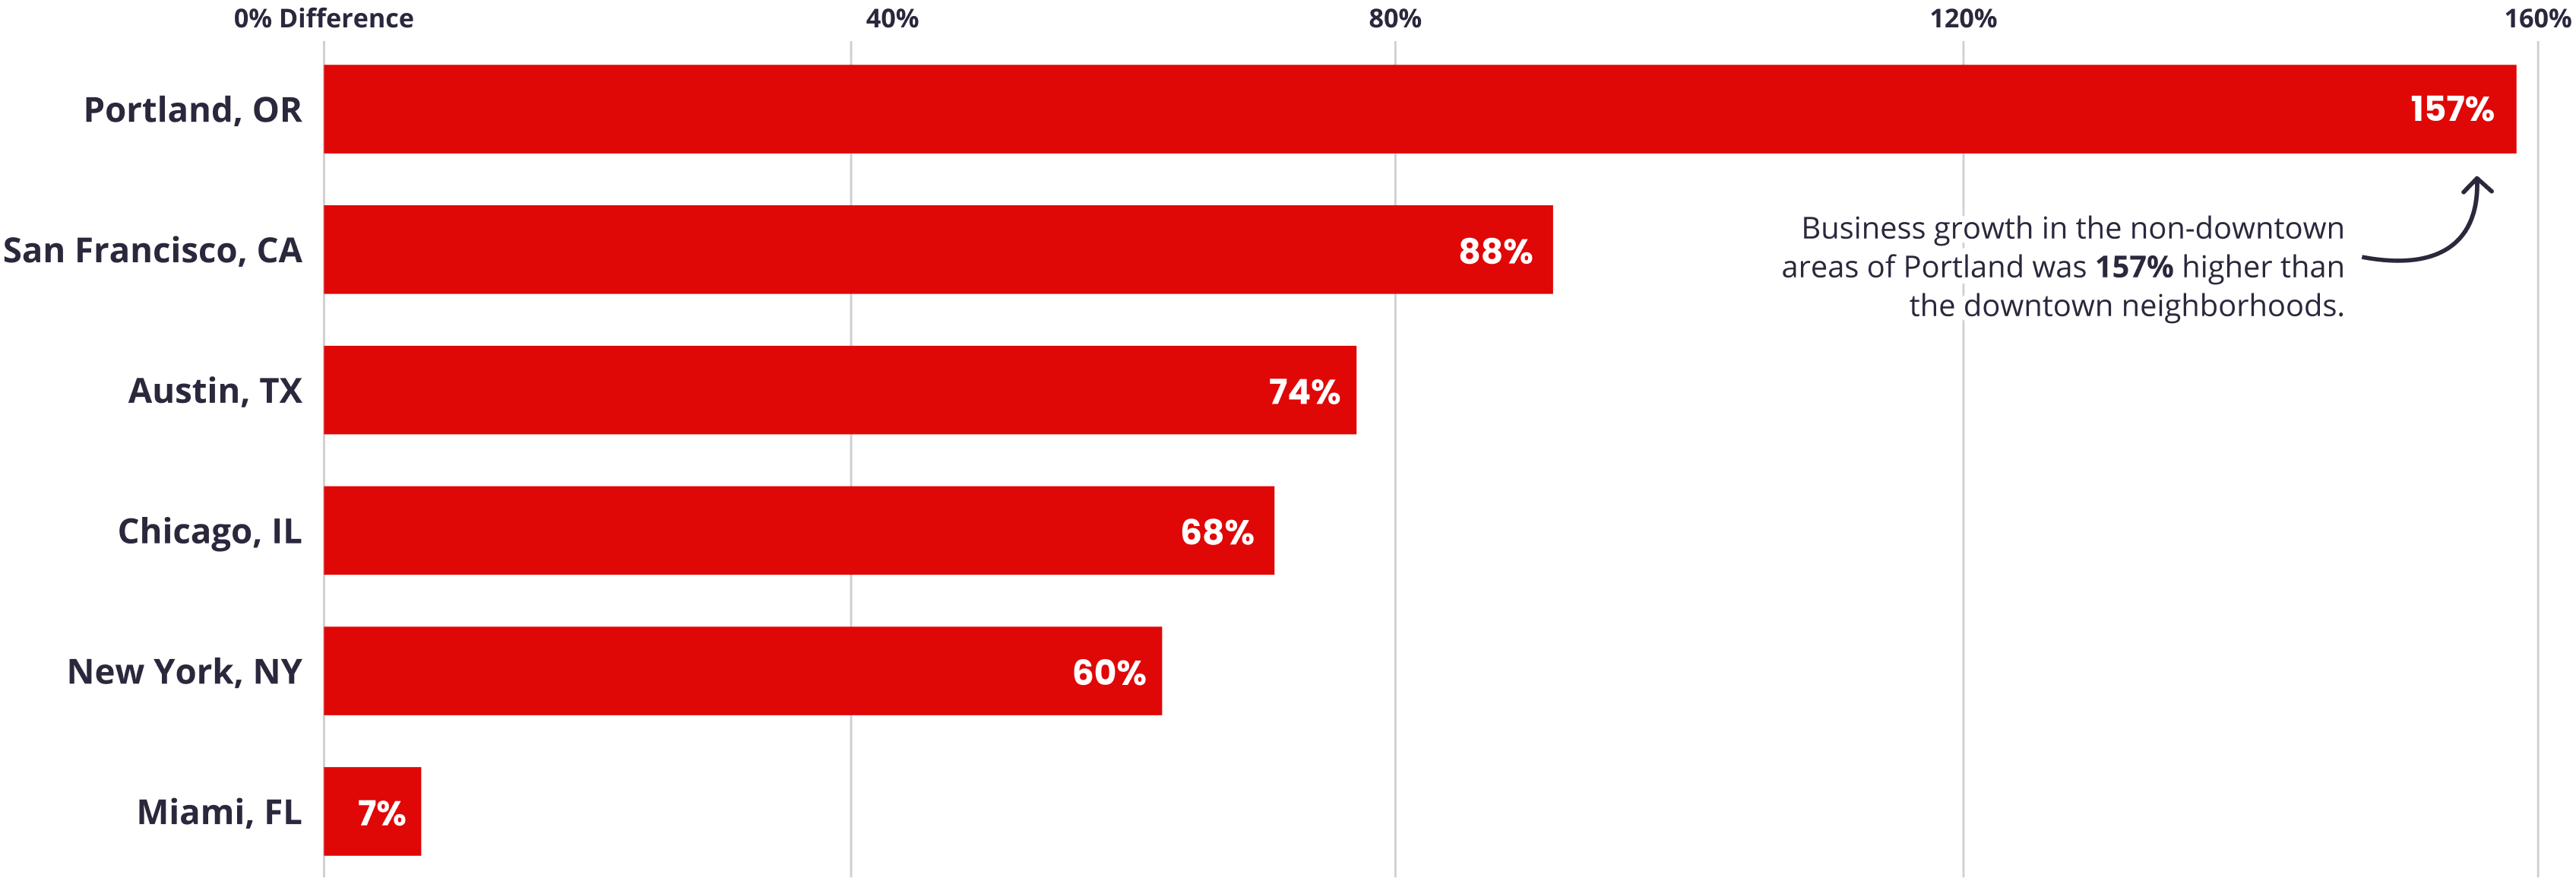
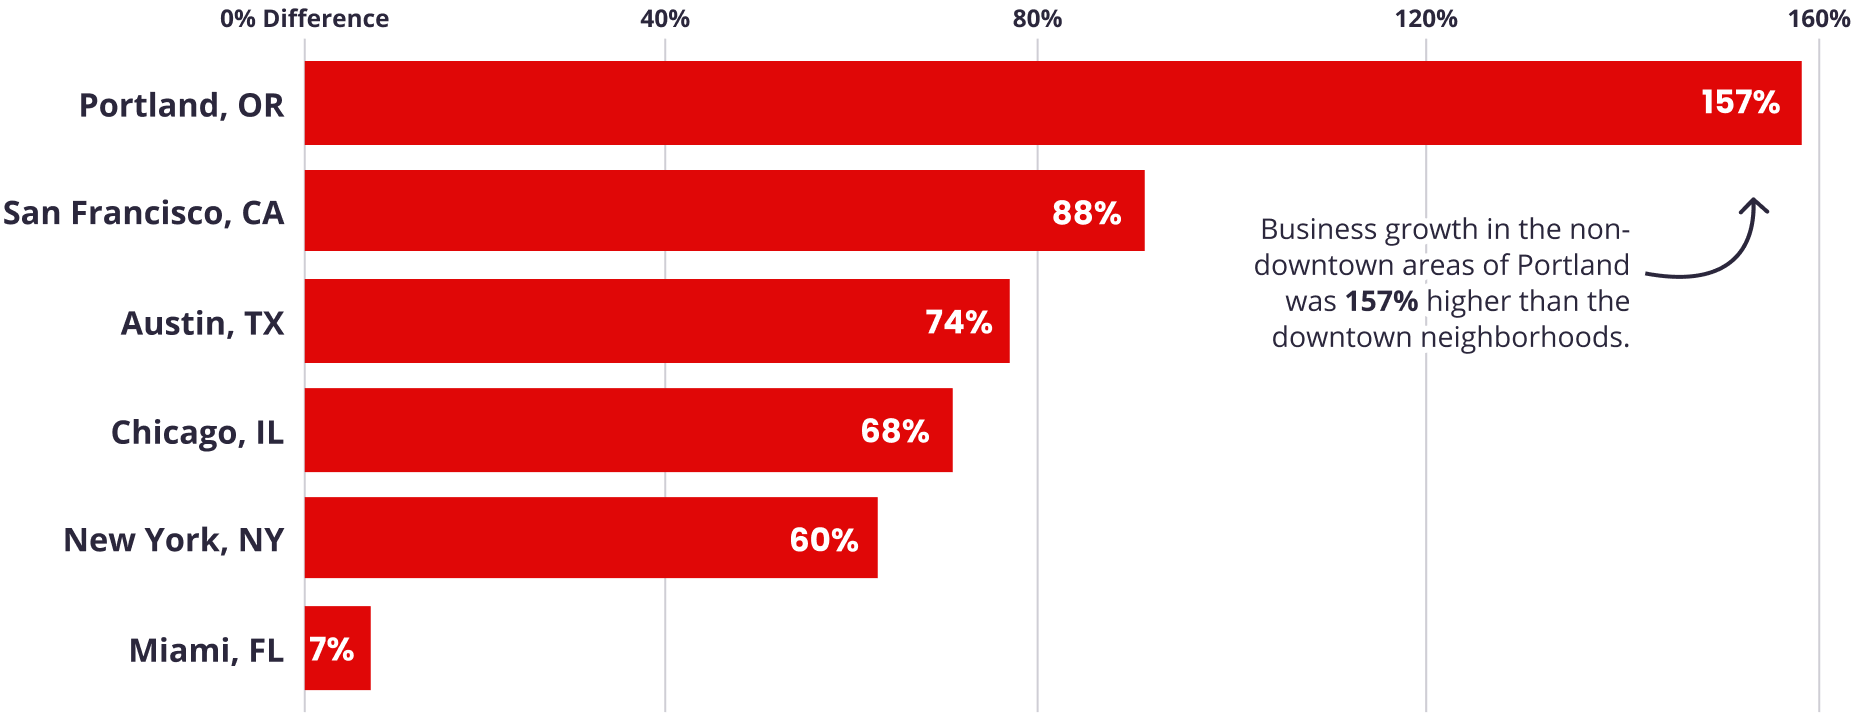
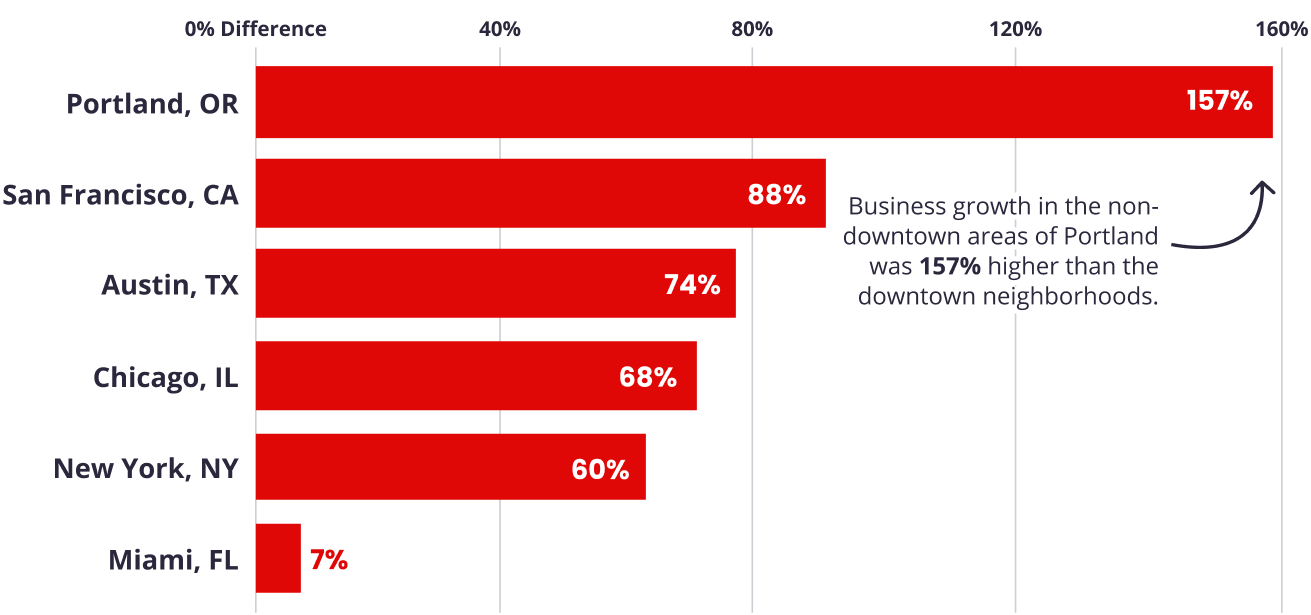
In addition to evaluating the average yearly business growth, Yelp compared the number of businesses in 2022 against the average number of businesses pre-pandemic (2017-2019) and while both downtown and non-downtown areas grew, non-downtown neighborhoods grew significantly more in Portland, OR; San Francisco, CA; Austin, TX; Chicago, IL; and New York City.
In Portland, the non-downtown neighborhoods grew by 157% more than downtown – the greatest difference in business growth between downtown and non-downtown areas of all the cities evaluated. In addition to business shutdowns due to the pandemic, downtown Portland also underwent nearly 200 days of protests following the murder of George Floyd calling for racial justice and police reform, which may have contributed to non-downtown neighborhoods recovering faster than downtown.
San Francisco saw the number of businesses in non-downtown neighborhoods grow 88% more than in downtown areas. Austin (74% higher growth in non-downtown) and Chicago (68% higher growth in non-downtown) followed as the cities with high non-downtown growth compared to the cities’ downtowns.
New York City saw the number of businesses in non-downtown areas grow by 60% more than its downtown. Downtown New York was the only area in which yearly business growth since 2020 is lower than pre-2020; its downtown average business growth since 2020 is 13% lower than pre-2020 – possibly due to the significant number of business closures early in the pandemic.
Miami saw the smallest percentage difference, with its non-downtown growing by 7% more than its downtown areas, but saw strong business growth overall – the average growth rates for both downtown and non-downtown areas in Miami are the highest among the six cities examined, likely driven in part by the growing number of tech companies that have moved to the area.
Non-Downtown Areas Have Seen More Business Growth Than Downtowns
Difference in the number of businesses in 2022 against the average number of businesses pre-pandemic (2017–2019) between downtowns and non-downtown areas
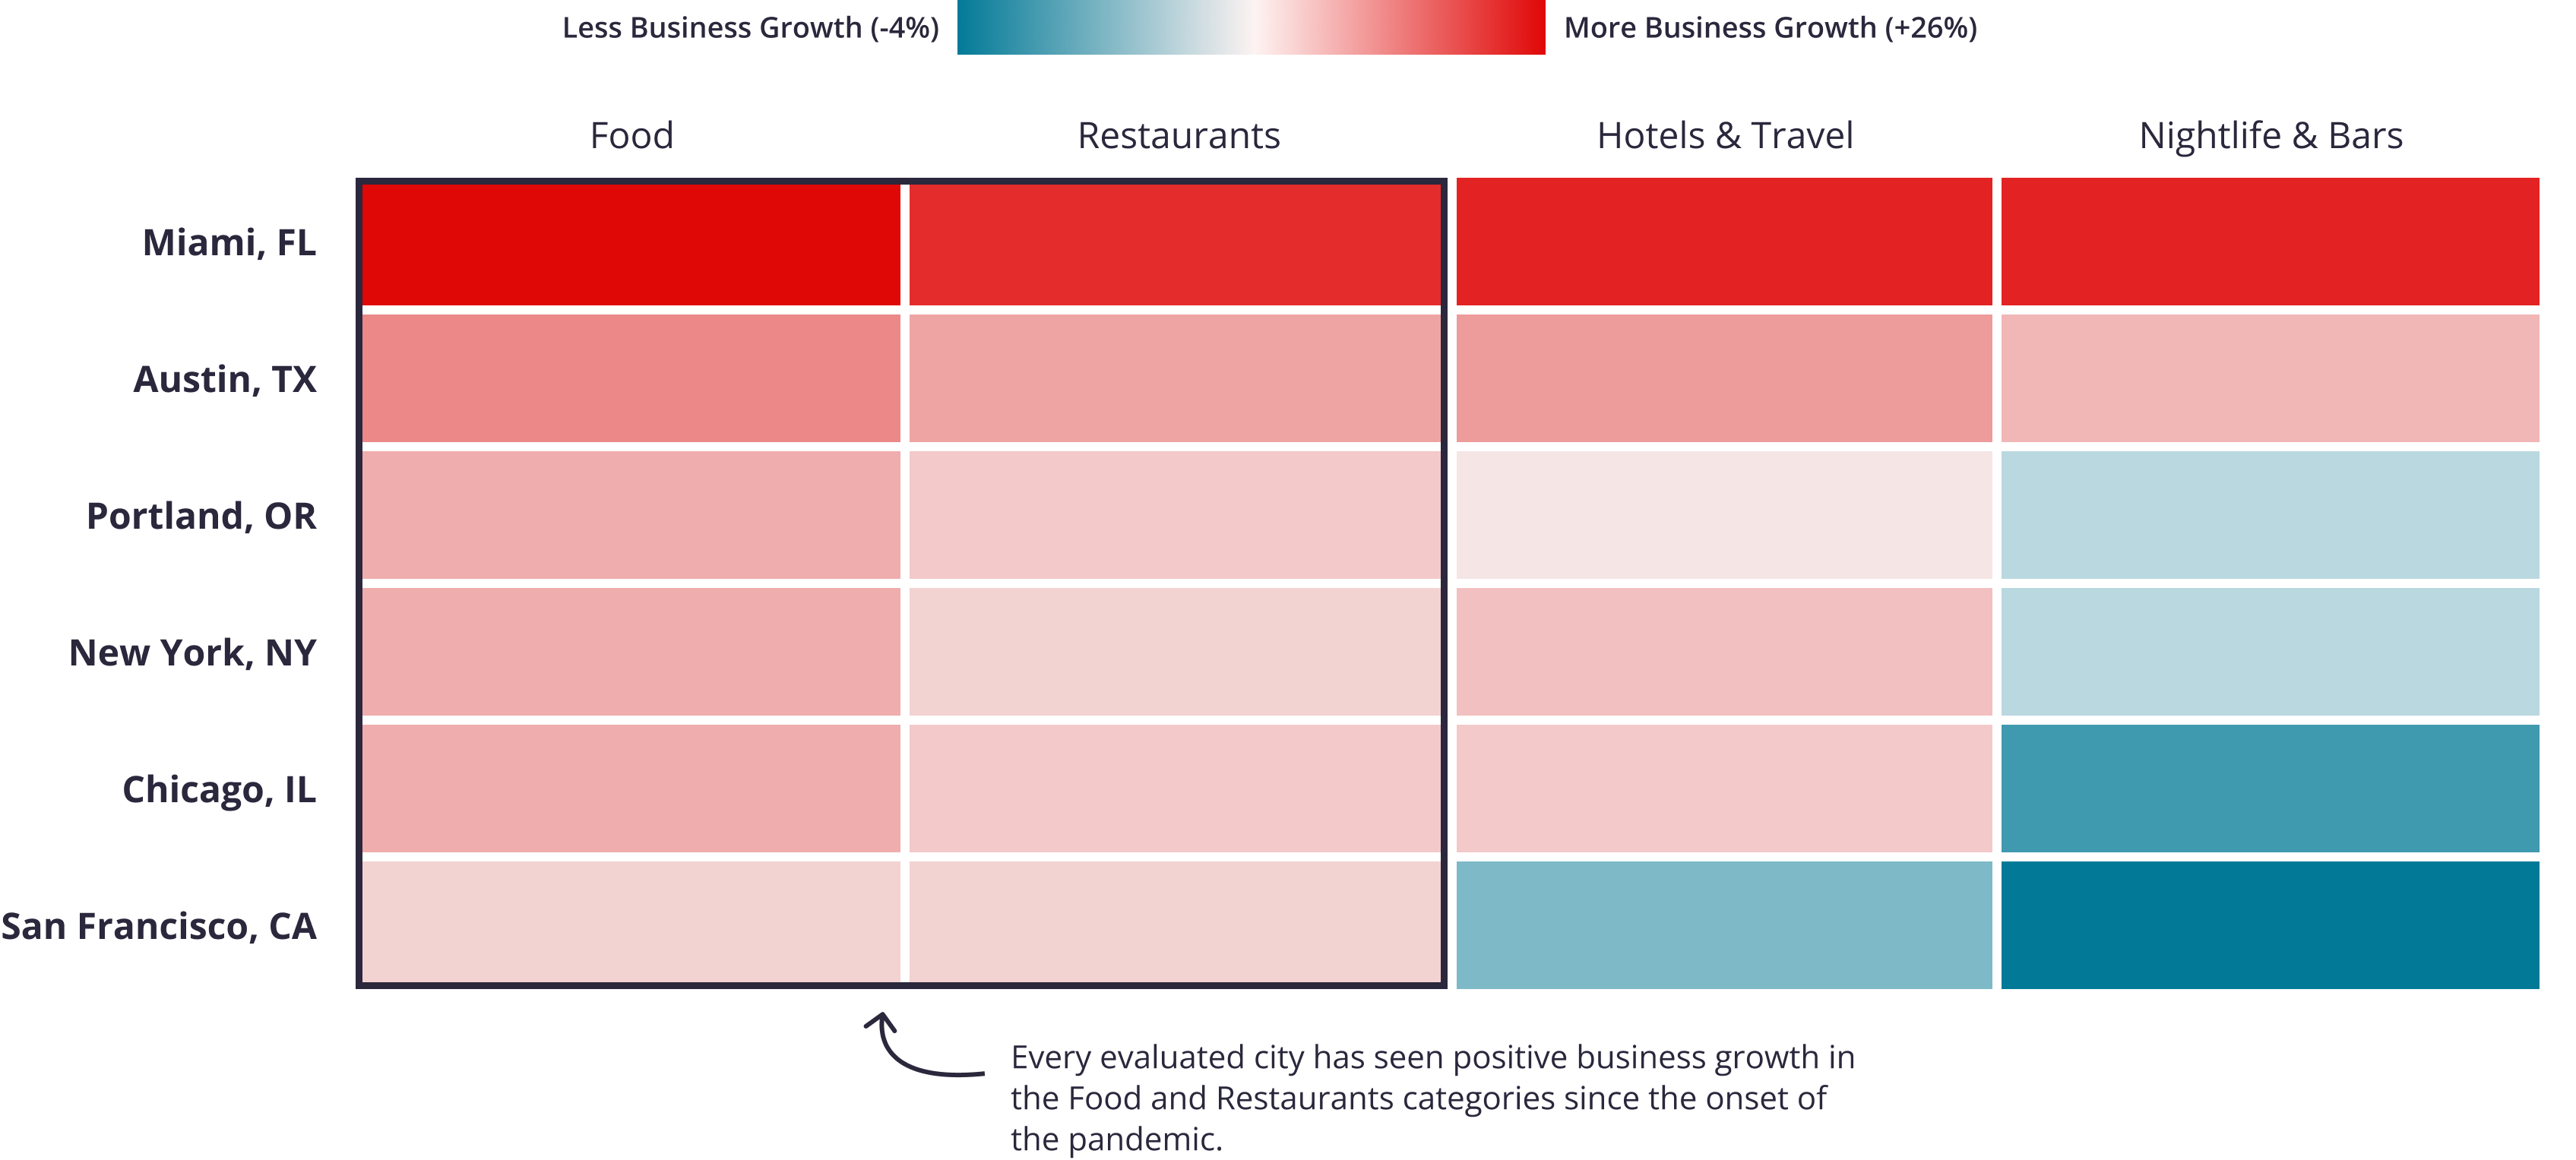
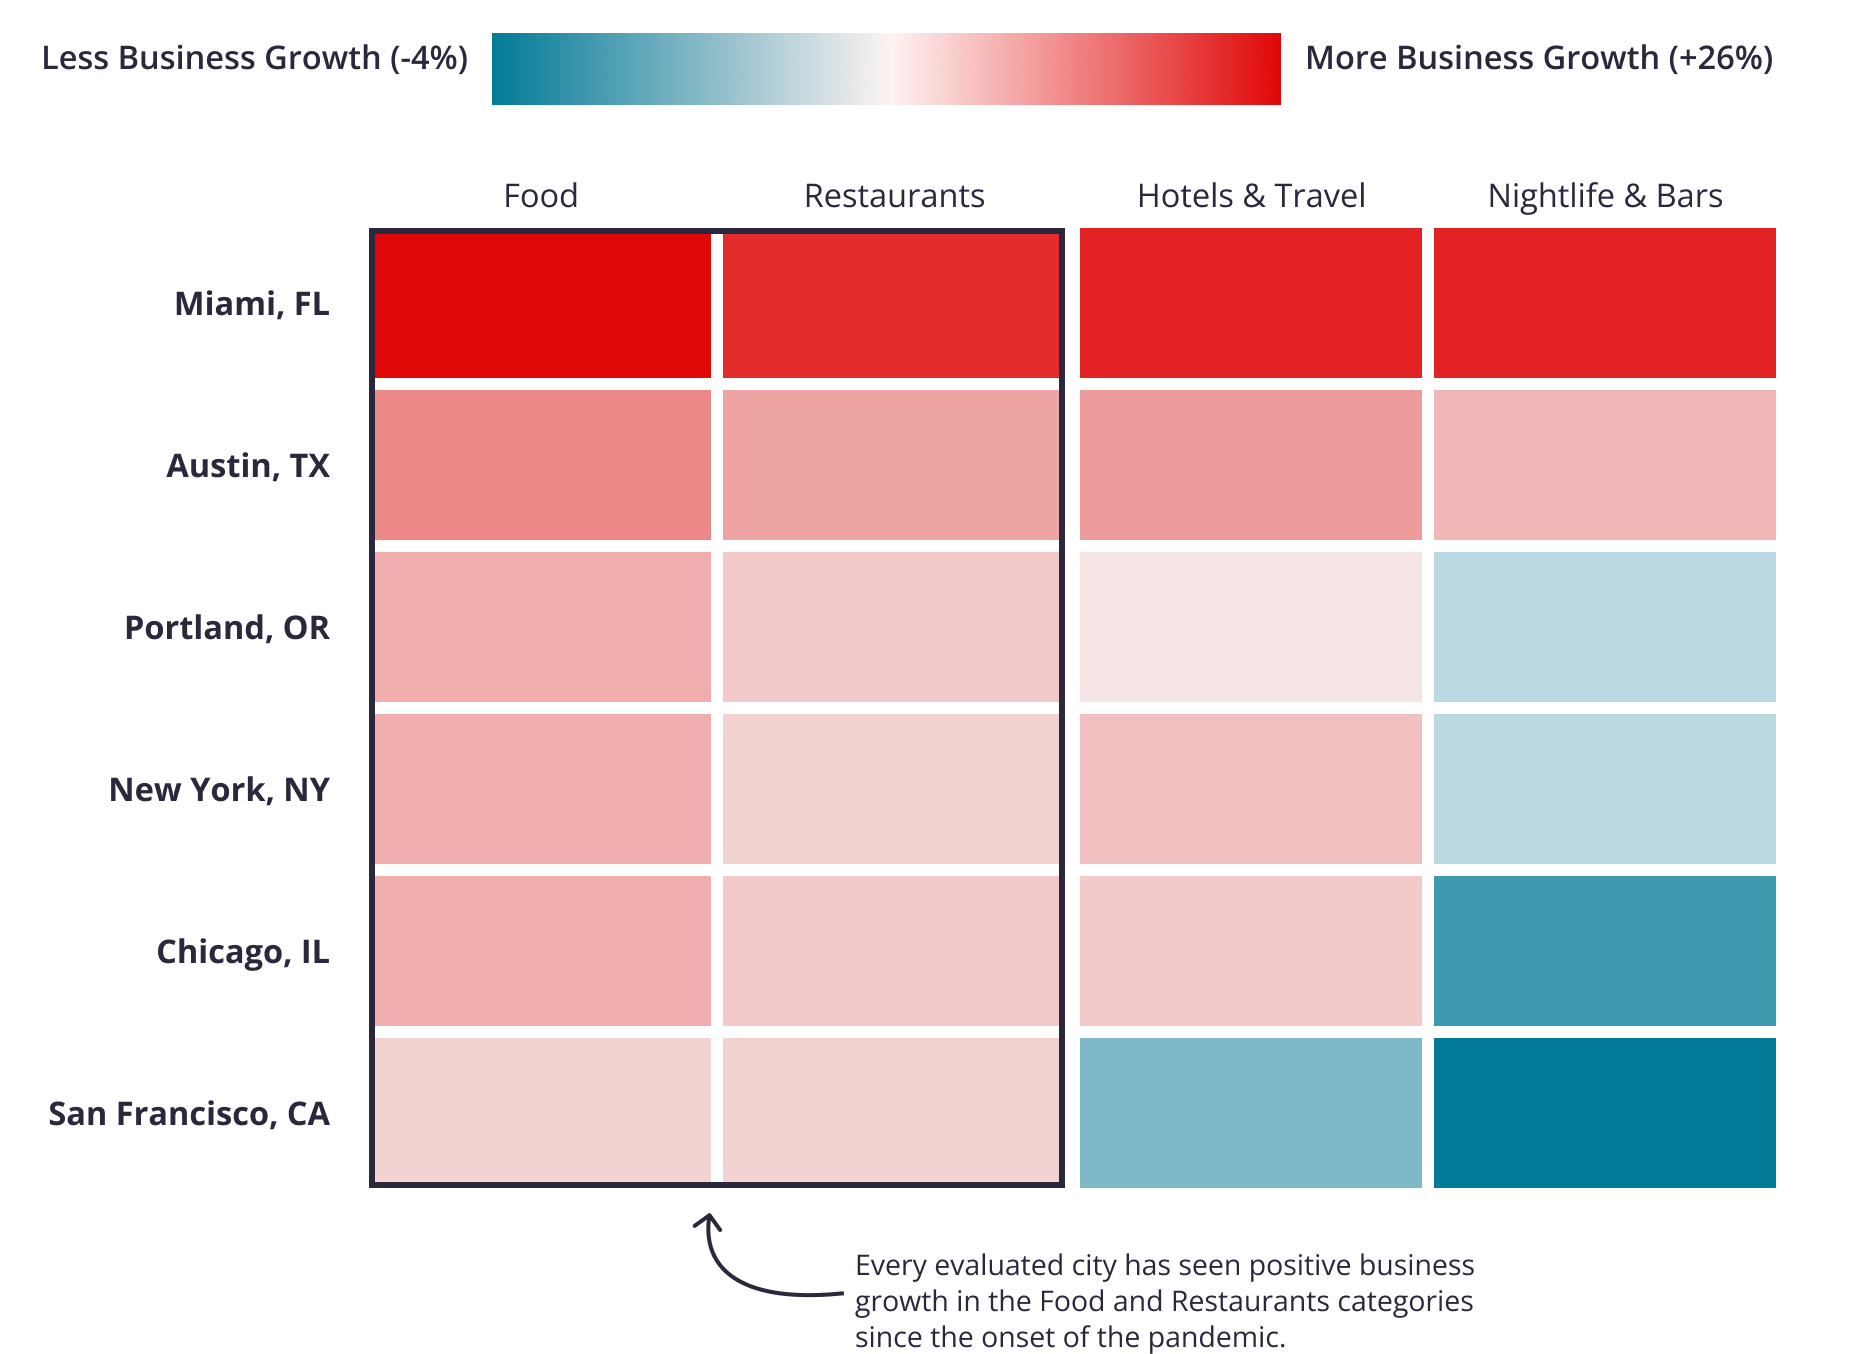
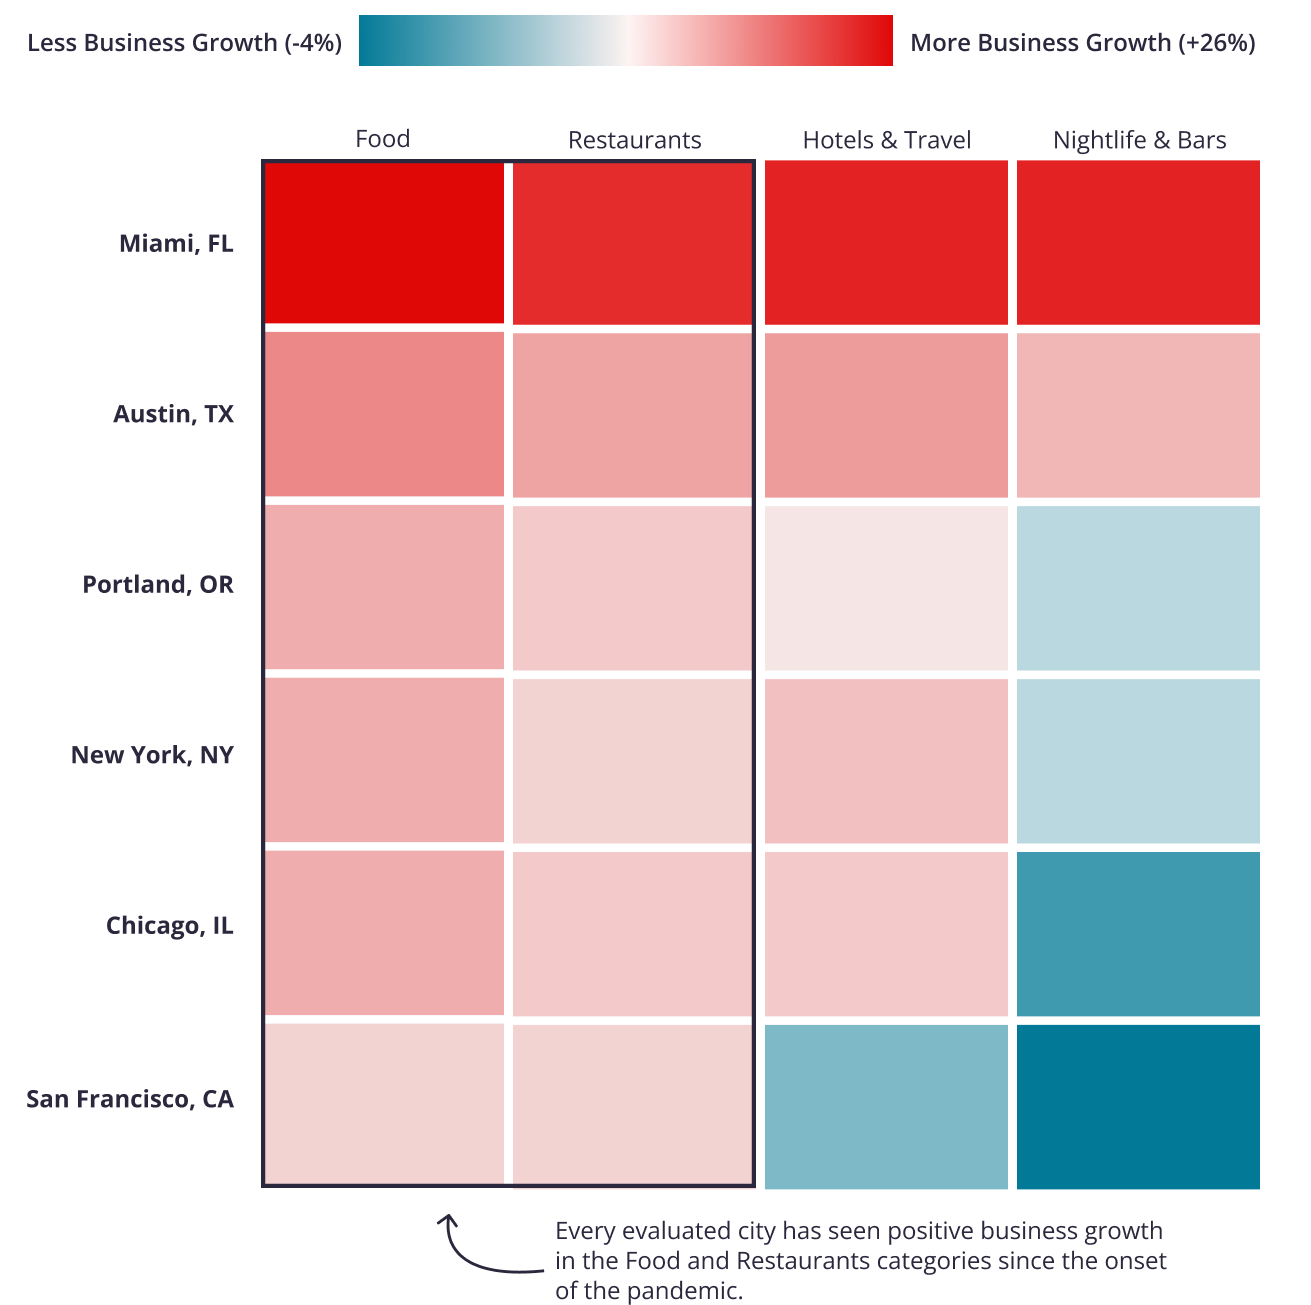
In non-downtown neighborhoods food businesses experienced the highest average growth during the pandemic
Some business categories are driving more growth in non-downtown neighborhoods than others. Food businesses, restaurants, nightlife & bars, as well as hotels & travel businesses are all seeing higher yearly average business growth in non-downtowns than in downtowns during the pandemic compared to the pre-pandemic average. In non-downtown neighborhoods of most cities evaluated, businesses in the food category saw the highest growth during the pandemic compared to pre-pandemic – the most significant category of business growth among the four categories. In Miami, Austin, Chicago, New York, and Portland, non-downtowns are seeing food business growth at 26%, 12%, 8%, 8% and 8%, respectively. Meanwhile, in San Francisco restaurants drove the most business growth in non-downtown areas (4% growth).
The Food Category Has Helped Drive Business Growth in Non-Downtown Areas
Average business growth in non-downtown areas by Yelp category, 2017–2019 vs. 2020–2022
While it’s promising to see both downtowns and non-downtowns continue to grow, the rapid growth in non-downtowns across the country demonstrates the positive economic opportunity that remote work has brought businesses in residential city neighborhoods, versus those in office-centric downtowns. Look for more analyses on how inflation has impacted local economies in our upcoming Q3 Yelp Economic Average.
If you'd like additional detail on how the economy is shifting, please contact us at press@yelp.com or join our mailing list to receive an email when new reports are released.
Interested in learning how Yelp data can assist you in developing market insights for your business? Yelp Knowledge can help, learn more here.
Methodology
To determine how the pandemic, shift to remote work and great reshuffling has impacted the downtowns of main metropolitan areas, Yelp compared the average business growth in April 2017 - 2019 (pre-pandemic) to April 2020 - 2022 (pandemic) across six downtowns relative to the rest of their respective cities.
To understand the dynamics of each metropolitan area, Yelp compared the city’s downtown and non-downtown areas’ by analyzing the number of businesses in 2022 against the average number of businesses pre-pandemic (2017-2019). By comparing a three year pre-pandemic average of total businesses to today’s total businesses we’re able to establish a stable baseline of pre-pandemic businesses to clearly understand how the pandemic has changed the business landscape across each main metropolitan area individually.
To determine the business categories growing in the non-downtown and downtown areas, Yelp examined the food, restaurants and nightlife categories as well as hotels and travel, comparing the average business growth in April 2017 - 2019 (pre-pandemic) to April 2020 - 2022 (pandemic).
We evaluated Portland, OR; San Francisco, CA; Austin, TX; Chicago, IL; Miami, FL; and New York City to provide a representative sample of cities across the U.S. “Business growth” refers to the change in the number of existing businesses. The “downtown” of a city was defined by identifying the main office centric neighborhoods.
Neighborhoods used to define the “downtown” area of a city:
- San Francisco - Financial District, Union Square, SoMa
- New York City - Manhattan Valley, Midtown, Midtown East, Financial District, Flatiron, Times Square, Garment District / Koreatown, Battery Park, Union Square, Hudson Yards, Harlem, Soho/Nolita, Chinatown, Lower East Side, Chelsea
- Austin - Downtown, Seaholm District, Market District, Clarksville, Rainey Street Historic District, Civic District, Medical District, West End, Second Street District, West Sixth District, Warehouse district
- Miami - Downtown, Brickell, Edgewater
- Chicago - The Loop, Streeterville, South Loop, River North, Gold Coast, West Loop
- Portland - Downtown, Old Town, Pearl, Northwest District
Downloadable static graphics can be found here.
See Yelp's previous Coronavirus Economic Impact Reports at our Data Science Medium, Locally Optimal.