
Two Years into the Pandemic, Yelp Data Reveals Impact on Local Economies
Monday, February 28th, 2022
For more on the methodology for this report, click here.
As we approach the second anniversary of COVID-19 being declared a global pandemic, recent data points to a decline in cases across the country and several states have begun to remove their mask mandates and lift vaccine requirements. Though even with high vaccination rates, the global health crisis remains fluid. To analyze how local economies are adapting, Yelp’s data science team examined each year of the pandemic to surface notable trends, which illustrate the pandemic’s impact on consumer behavior and business growth. The findings highlight a preference for outdoor dining and activities, an increase in businesses offering contactless payments, and how new variants have impacted business openings.
Business Openings Increased Nationally in Year Two of the Pandemic
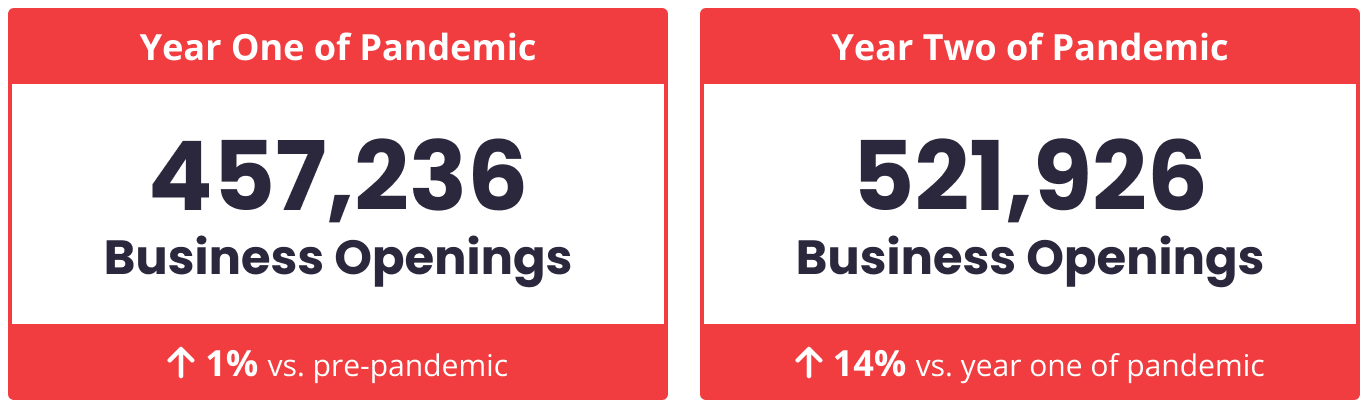
While the onset of the pandemic resulted in many businesses temporarily closing, by October 2021 85% of those local businesses were able to reopen. Even amidst growing concerns of inflation, supply chain constraints and a labor shortage, Yelp data indicates year two of the pandemic brought more new business to local economies. New business openings increased 14% in year two of the pandemic to 521,926, up from 457,236 in year one of the pandemic, and were generally in line with the year prior to the pandemic (down by only 1%).
New Business Openings Rebounded in Year Two of the Pandemic
New COVID-19 Variants Slowed Business Openings in Nearly All of the Largest U.S. Cities
Despite strong new business growth nationally, the emergence of new COVID-19 variants in the U.S. (in particular the Delta and Omicron variants) resulted in a decrease in new business openings in nearly all of the largest metro areas in the country. Boston, Seattle, Los Angeles and New York City saw the largest decreases in new business openings during Delta and Omicron variant waves. Meanwhile, Atlanta, Dallas, and Detroit bucked the trend with an increase in the number of new business openings during the arrival of the Delta and Omicron variants.
Business Openings Slowed During New COVID-19 Variants in Most Major Metros, Except in the South
5% Change
15% Change
Increase
Decrease
Consumers Continue to Show Strong Preference for Outdoor Dining and Activities
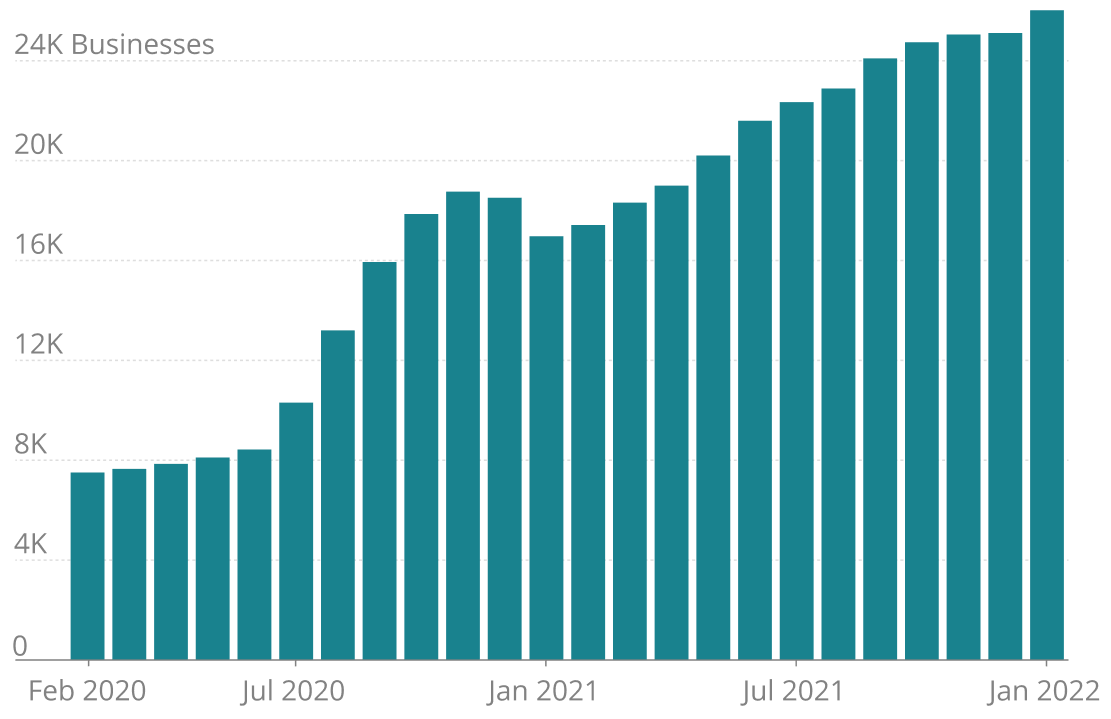
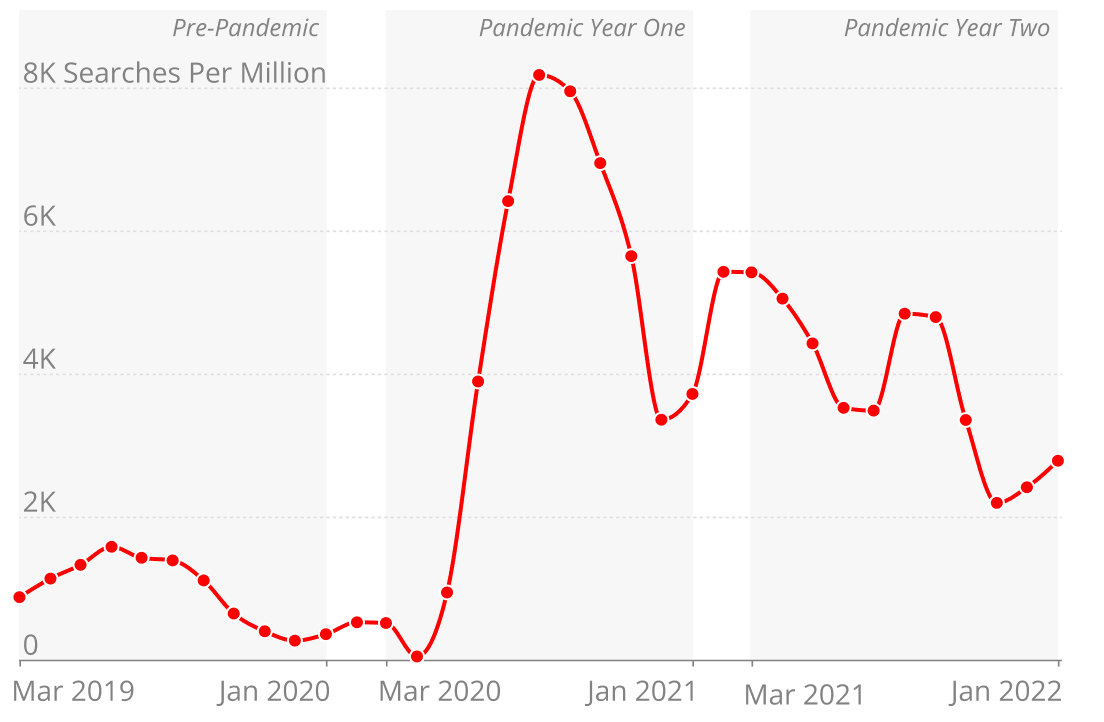
The pandemic fueled a shift towards open-air dining and gathering to reduce the likelihood of spreading the virus, and Yelp data indicates that this trend remains strong today. The number of businesses adopting the outdoor dining attribute has grown every month since the pandemic began – reaching 25,999 in January 2022. Consumers searching for businesses with outdoor seating continues to be above pre-pandemic levels increasing 292% in year two of the pandemic when compared to pre-pandemic searches.
Businesses Offering Outdoor Dining Grew as Demand Soared During the Pandemic
Businesses With “Outdoor Seating” Attribute
Feb 2020 – Jan 2022
Searches for “Outdoor Seating”
Mar 2019 – Jan 2022
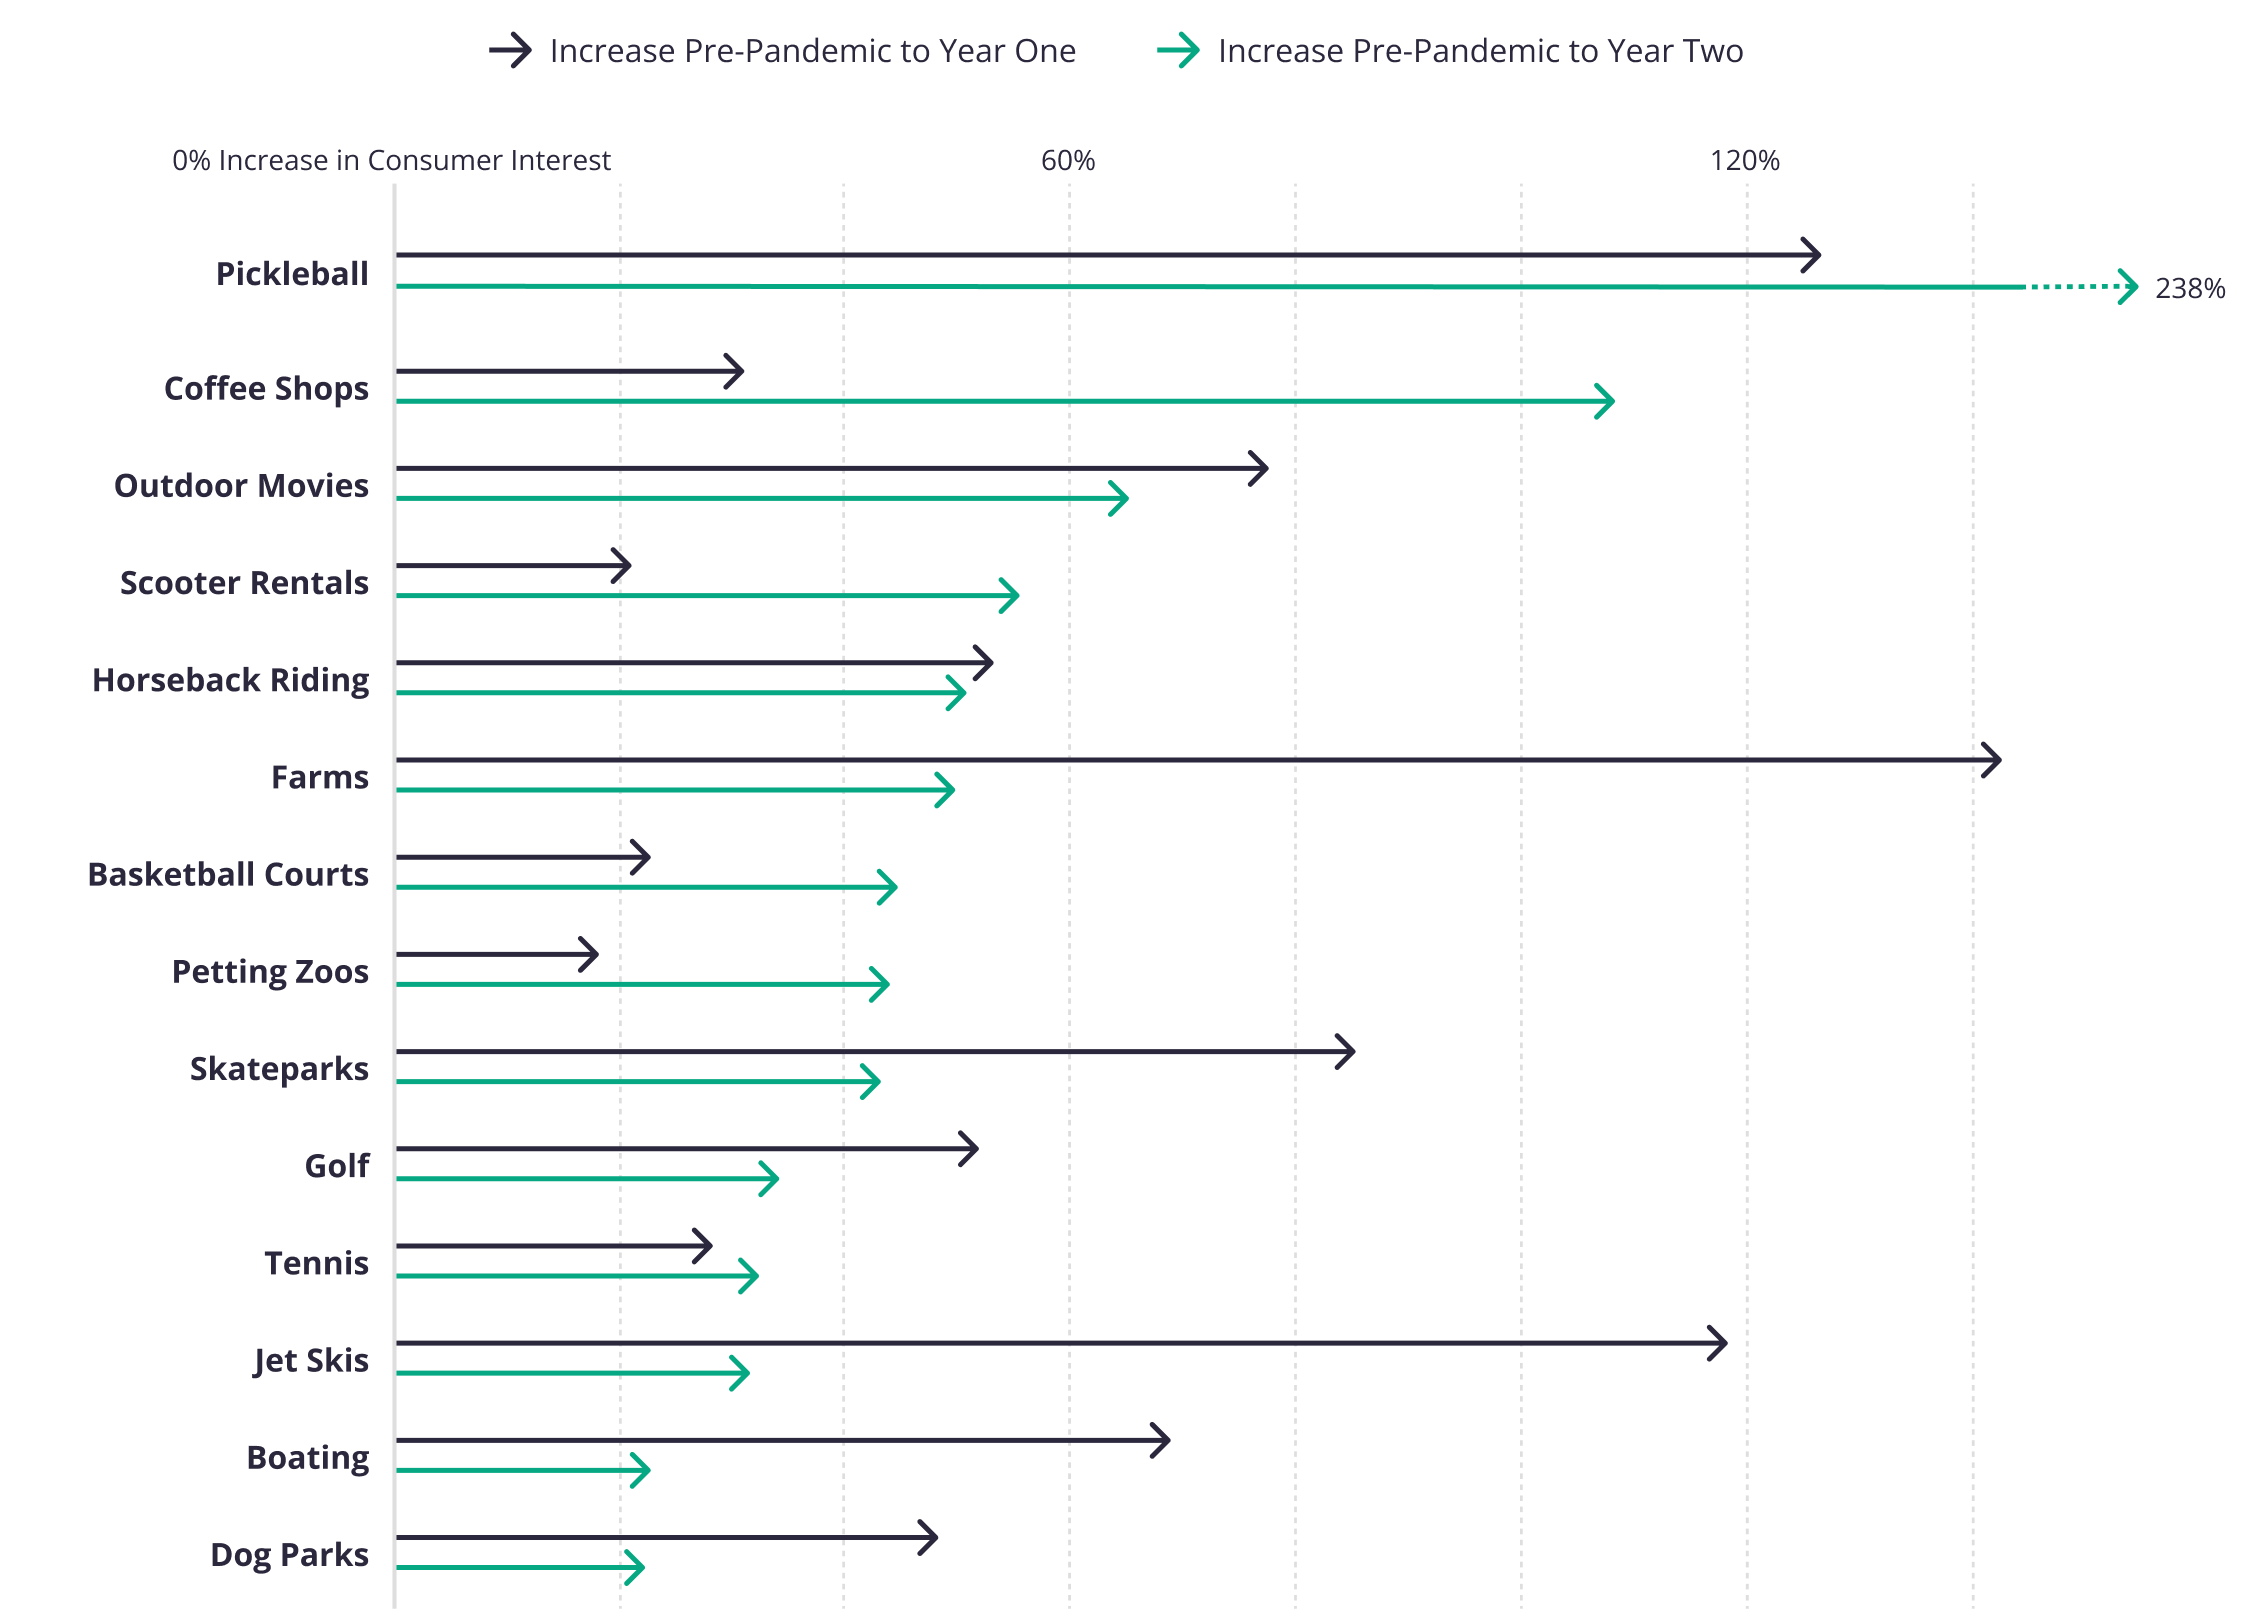
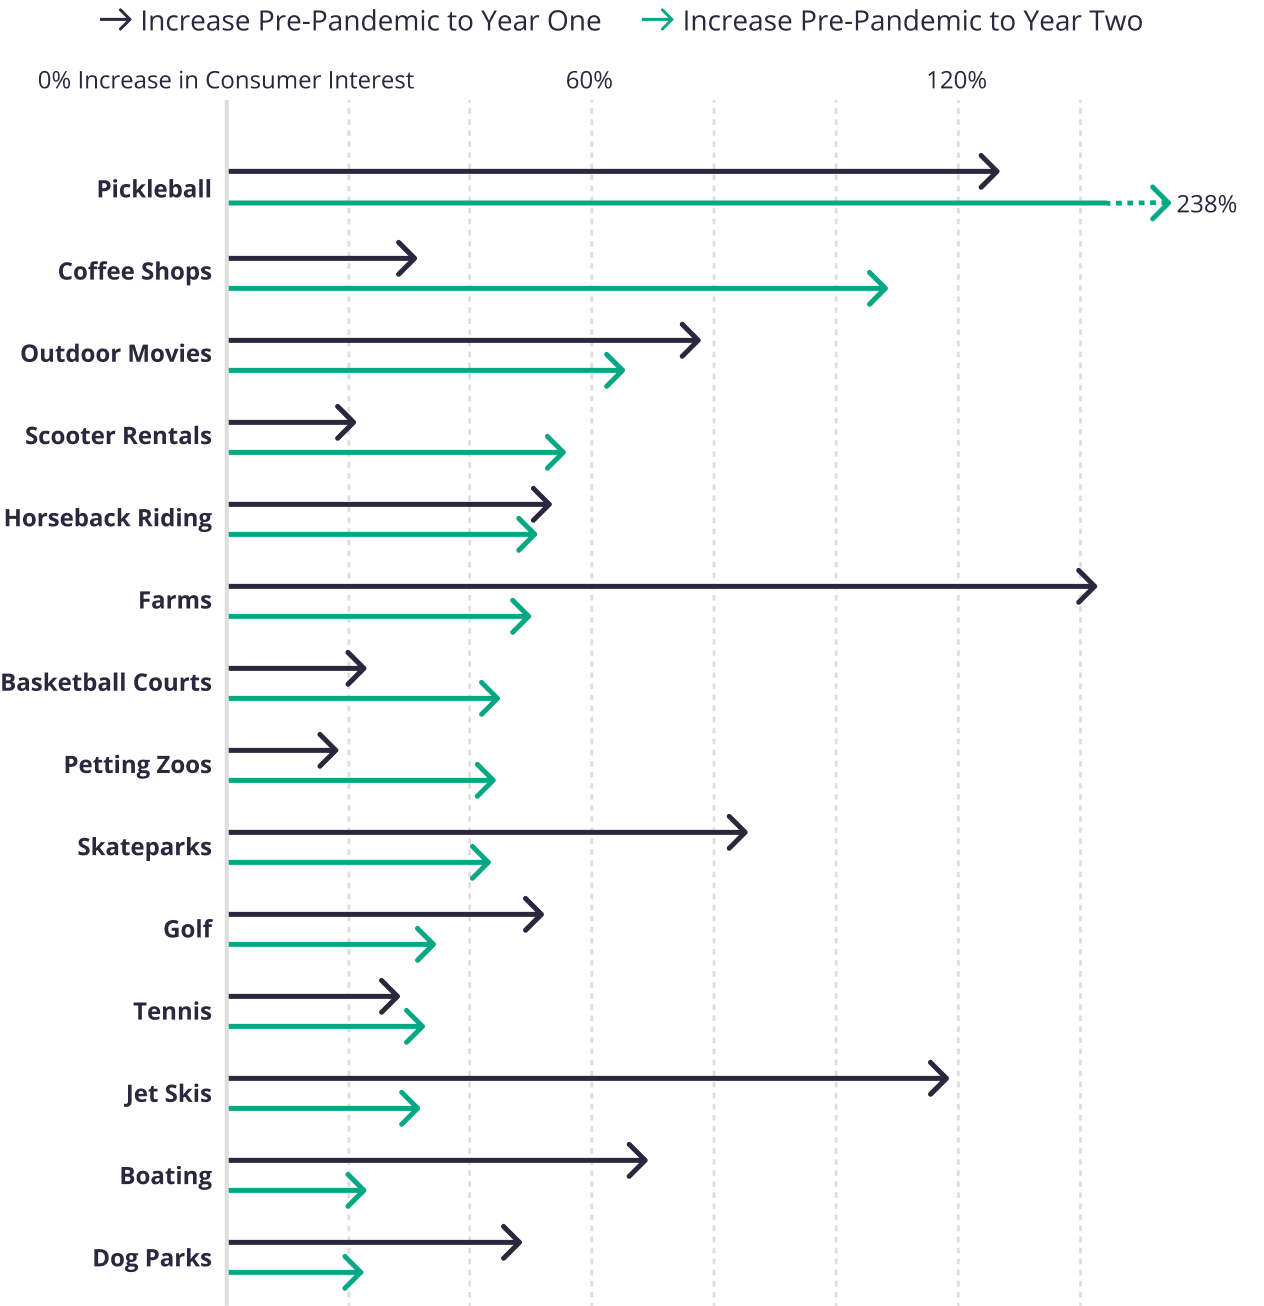
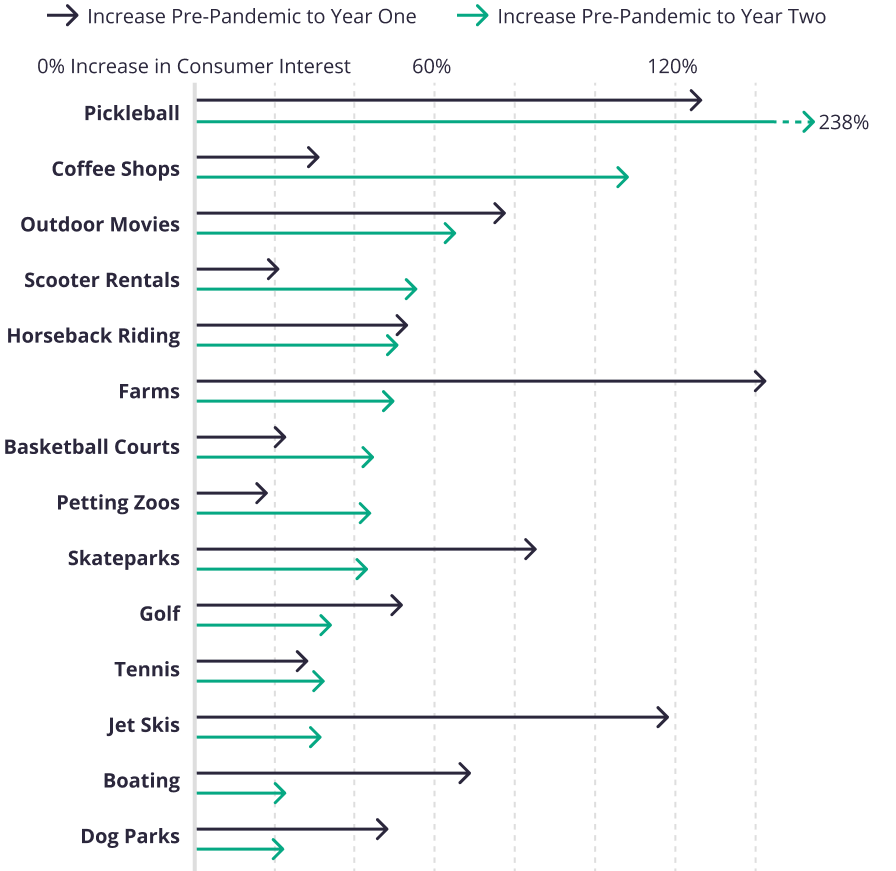
It is not just dining outdoors that is seeing an uptick in interest – outdoor activities across several categories have seen sustained popularity on Yelp. In year two of the pandemic, consumer interest increased above pre-pandemic levels in many outdoor activities including ATV and scooter rentals, horseback riding, tennis and golf among others. Notably during the same period consumer interest in coffee shops increased 108% – a favorite for both outdoor seating and wifi accommodations for remote workers.
Consumer Interest in Outdoor Activities Remain Above Pre-Pandemic Levels
Increase in consumer interest for select categories on Yelp
Businesses Adopting Contactless Payments Grew Exponentially During the Pandemic
In the years prior to the pandemic, contactless payments including Apple Pay and Google Pay, and “tap to pay” credit and debit cards, were slowly gaining popularity. As businesses and customers looked for ways to decrease potential exposure to COVID-19, opting for contactless payment has shown a tremendous uptick on Yelp. Over 12,000 businesses on Yelp have opted into the contactless payment attribute since it became available in 2020.
The pandemic has undeniably changed consumer needs and business operations for the foreseeable future. As things continue to evolve, we expect local businesses to successfully adapt and continue to deliver the goods and services that are vital to so many local economies.
— Jessica Mouras, Jenny Kao and Will Langston contributed to this report.
If you'd like additional detail on how the economy is shifting, please contact us at press@yelp.com or join our mailing list to receive an email when new reports are released.
Interested in learning how Yelp data can assist you in developing market insights for your business? Yelp Knowledge can help, learn more here.
Methodology
Business Openings Top CBSAs (COVID Variant Comparison)
In this analysis we identified the months July and August as the “Delta variant” period and the months of December and January as an “Omicron variant” period. By totalling the number of business openings during these months in 2019, 2020, and 2021, we compared the effects of the “Delta” and “Omicron” variants of COVID-19 on business openings across the US. We selected the largest 20 CBSAs (core based statistical areas) that represent densely populated metropolitan areas of the US to provide diverse geographic context for these comparisons.
Business Openings
Openings are determined by counting new businesses listed on Yelp, which are added by either business representatives or Yelp users. Openings are adjusted year-over-year, meaning openings are measured relative to the same time period in the previous period for the same business categories and geographic locations. This adjustment corrects for both seasonality and any differences in the baseline level of Yelp coverage in any given category and geography.
Changes in business openings were measured by comparing year-over-year data from March 2019 - January 2020 (pre-pandemic), March 2020 - January 2021 (first year pandemic), and March 2021 - January 2022 (second year pandemic).
Consumer Interest Actions
We measure consumer interest in terms of a few of the many actions people take to connect with businesses on Yelp: viewing business pages, or posting photos or reviews. Changes in consumer interest for each category were measured by comparing year-over-year data from March 2019 - January 2020 (pre-pandemic), March 2020 - January 2021 (first year pandemic), and March 2021 - January 2022 (second year pandemic), focusing on each category’s share of all consumer actions in its root category.
Attribute Adoption
Yelp data tracks when business owners opt into features on their business page. This is the count of businesses that have self-identified as participants of the attributes: outdoor seating and contactless payment.
Search Query Filters
Search data is used to understand what consumers are searching for throughout the year. To gather this data, we looked at all search query entries for the restaurant category. To compare the change in volume of a specific search query, we evaluated the number of times per million searches the query filter was enabled. We evaluated this for each week of 2021, 2020, and 2019 to determine the year-over-year relative change in search share over time.
Downloadable static graphics can be found here.
See Yelp's previous Coronavirus Economic Impact Reports at our Data Science Medium, Locally Optimal.